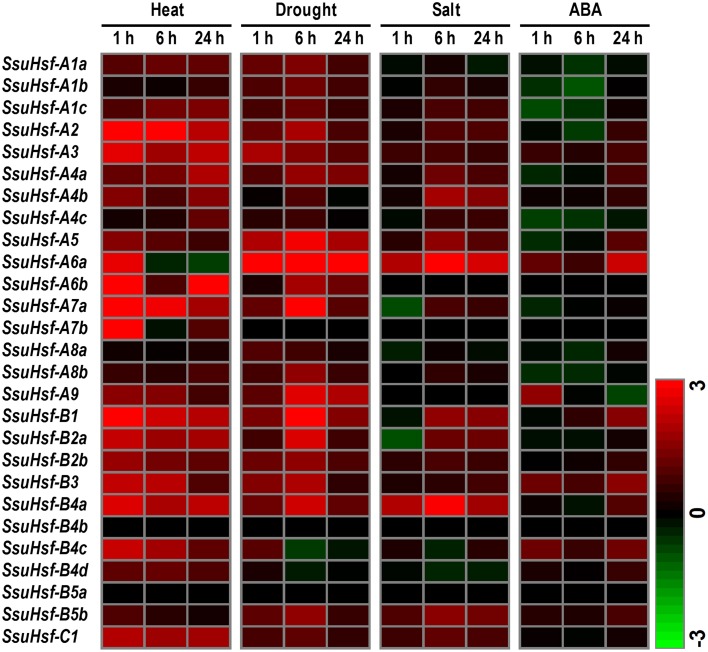
Figure 8.
Expression analyses of SsuHsfs under abiotic stresses. Heat map representation for the expression patterns of 27 SsuHsf genes after treated for 1, 6, or 24 h under heat (37°C), drought (20% PEG), salt (150 mM NaCl), or 100 μM ABA. The expression levels of genes were determined using RT-PCR. The different colors correspond to log2 transformed values compared with control (0 h). Green indicates down-regulation and red represents up-regulation. The data were generated by averaging the fold change from each of the three biological replicate experiments. Details of the expression data are listed in Table S3.

