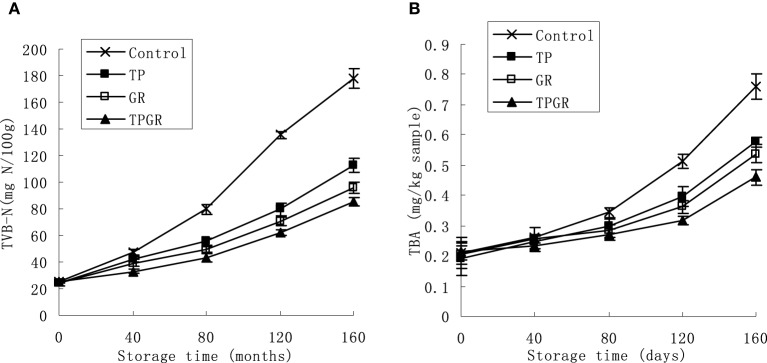
Figure 1.

Changes in TVB-N (A) and TBA (B) of shrimp paste treated with control (×), TP (■), GR (□), and TPGR (▲) stored at 25°C for 160 days. Each data point is the mean of three replicate samples. Vertical bars represent standard deviation of means.
