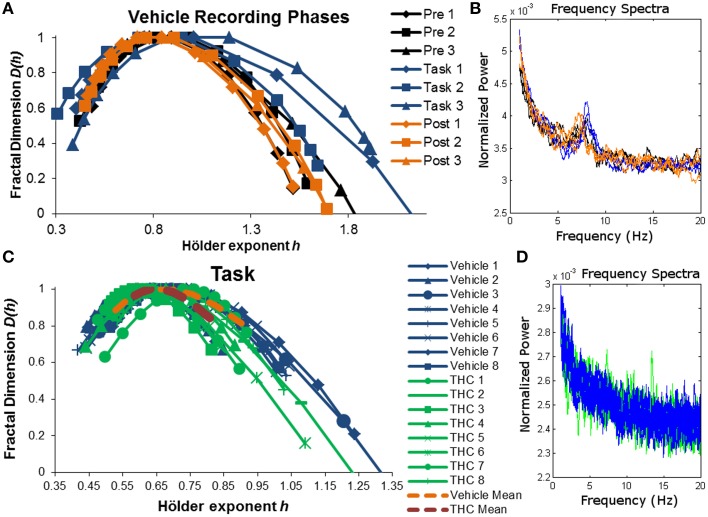
Figure 4.
Singularity and frequency spectra of example neurons. Singularity and frequency spectra pairs are shown for two different CA1 neurons. Single neurons were measured across multiple days in various recording phases (pre-task, task, post-task) and drug conditions (vehicle or THC) and each spectrum trace represents the multifractal complexity (A,C) and frequency content (B,D) computed from one recording phase on 1 day. (A) Singularity spectra are shown for each recording phase over three vehicle experiment days (diamonds for day 1, squares for day 2, triangles for day 3). Singularity spectra are wider, thus multifractal complexity is greater, during the task compared to either resting state recording phases. (B) Frequency spectra are shown for the same neuron recorded during the same 3 days as in (A) and color coded to match the legend in (A). This neuron exhibits both delta (0.5–4 Hz) and theta (4–8 Hz) frequency activity during all recording phases on all days. (C) Singularity spectra computed from the DNMS task are compared between vehicle and THC conditions for one example neuron recorded over 16 total days. Individual session singularity spectra are plotted in thin blue lines for vehicle and green lines for THC sessions. The average singularity spectra for this neuron is plotted as a dashed orange line for vehicle and as a dashed red line for THC. (D) Frequency spectra are shown for the same neuron recorded during the same 16 days as in (C) and color coded to match the legend in (C). Only spectra from individual neurons were plotted. This neuron exhibits delta rhythm only.

