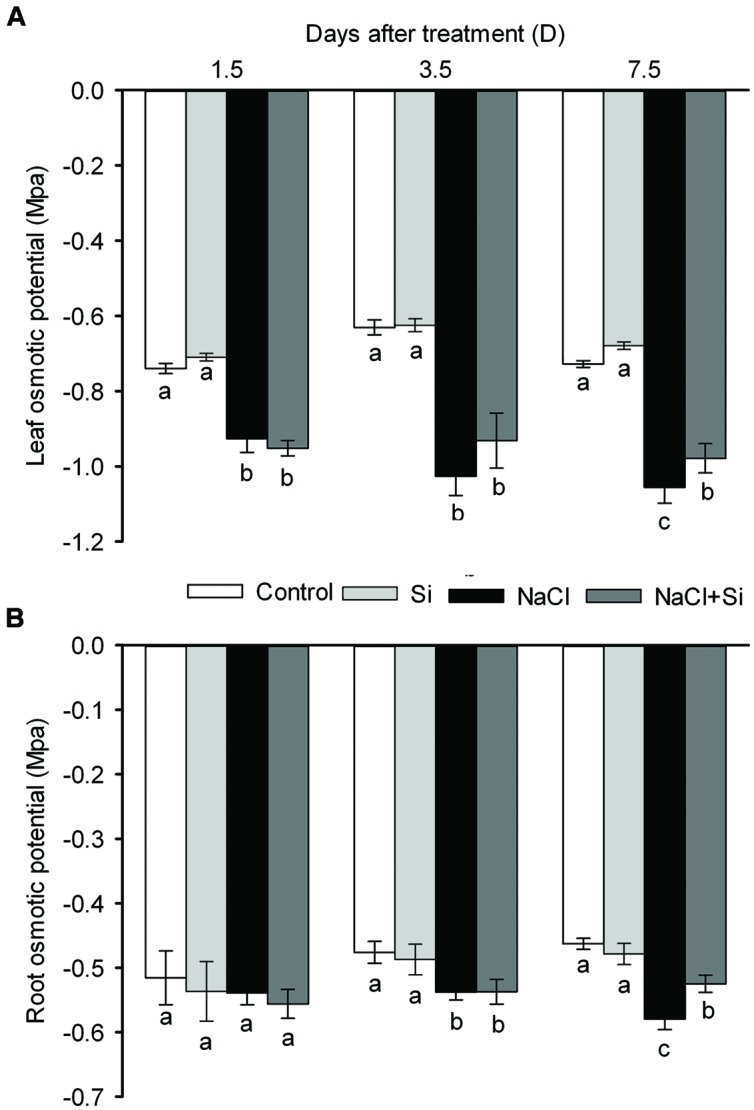
FIGURE 4.

Effects of silicon (0.83 mM) and salt stress (65 mM) on leaf (A) and root osmotic potential (B). All parameters were measured after 1.5, 3.5, and 7.5 days of salt treatment. Vertical bars represent the standard deviations (n = 3). Different letters at the same time point represent significant differences (p < 0.05) between the treatments.
