
FIGURE 6.
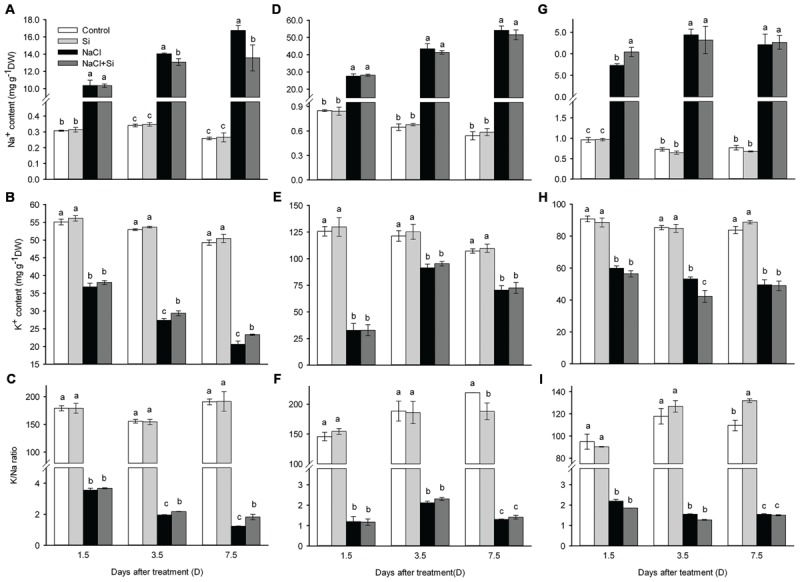
Effects of silicon (0.83 mM) and salt stress (65 mM) on Na+ (A, leaf; D, stem; G, root), K+ (B, leaf; E, stem; H, root) concentration and K+/Na+ ratio (C, leaf; F, stem; I, root). All parameters were measured after 1.5, 3.5, and 7.5 days of salt treatment. Vertical bars represent the standard deviations (n = 3). Different letters at the same time point represent significant differences (p < 0.05) between the treatments.