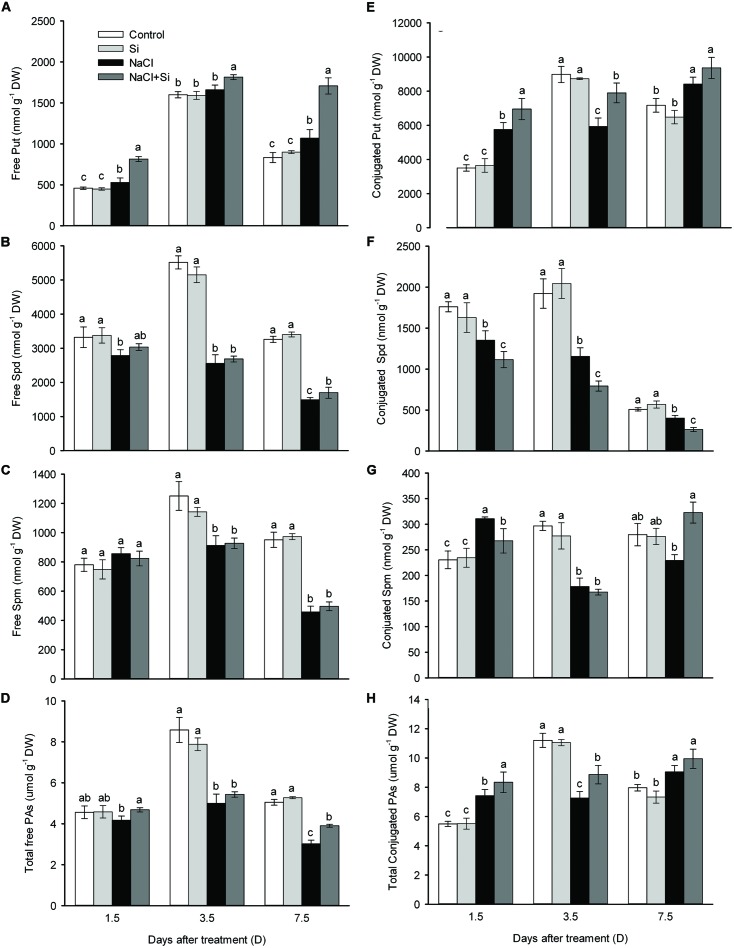
FIGURE 7.
Effects of silicon (0.83 mM) and salt stress (65 mM) on polyamines (PAs) concentrations (putrescine, Put; spermidine, Spd; and spermine, Spm; (A) Free Put; (B) Free Spd; (C) Free Spm; (D) Total free polyamines; (E) Conjugated Put; (F) Conjugated Spd; (G) Conjugated Spm; (H) Total conjugated polyamines). Root tips (1 cm) were used for measurement. All parameters were measured after 1.5, 3.5, and 7.5 days of salt treatment. Vertical bars represent the standard deviations (n = 3). Different letters at the same time point represent significant differences (p < 0.05) between the results of the treatments. Sharing the same letter indicates no significant difference.

