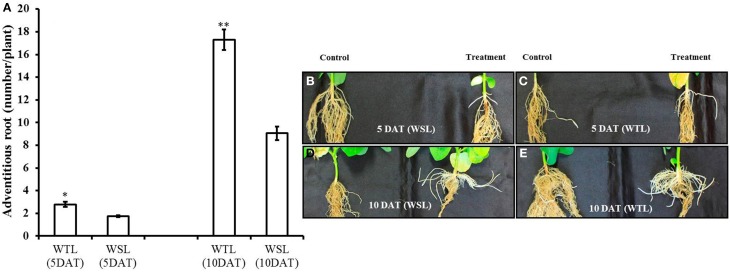
Figure 1.
Number of adventitious root and images of adventitious roots at 5 and 10 days after waterlogging stress. In the figure, (A) indicates the number of adventitious roots and WTL indicates the waterlogging tolerant line (PI408105A), and WSL indicates the waterlogging susceptible line (S99-2281). (B–E) Indicate the images of adventitious roots and in each picture, the control plant is on the left, and waterlogging treated plant on the right. In (A), star marks indicate a significant difference between control and treatment at P < 0.05 or P < 0.01. Data show average ± standard error (n = 20) and was collected over three replications.

