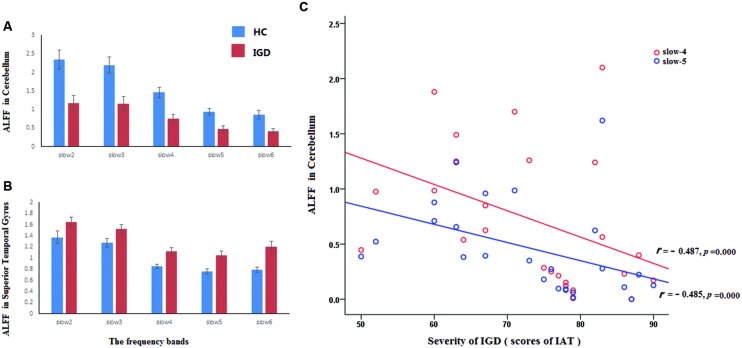
FIGURE 2.
The ALFF values in superior temporal gyrus and the cerebellum. The red and blue rectangle represented IGD subjects and healthy controls, respectively. The full frequency band (0–0.25 Hz) was divided into five bands. They were displayed in (A,B) [slow-6 (0–0.01 Hz), slow-5 (0.01–0.027 Hz), slow-4 (0.027–0.073 Hz), slow-3 (0.073–0.198 Hz), and slow-2 (0.198–0.25 Hz)]. (C) Reveled the ROI-based correlation between the severity of IGD and the ALFF values in the cerebellum, the red and blue line represented frequency slow-4 and slow-5, respectively.

