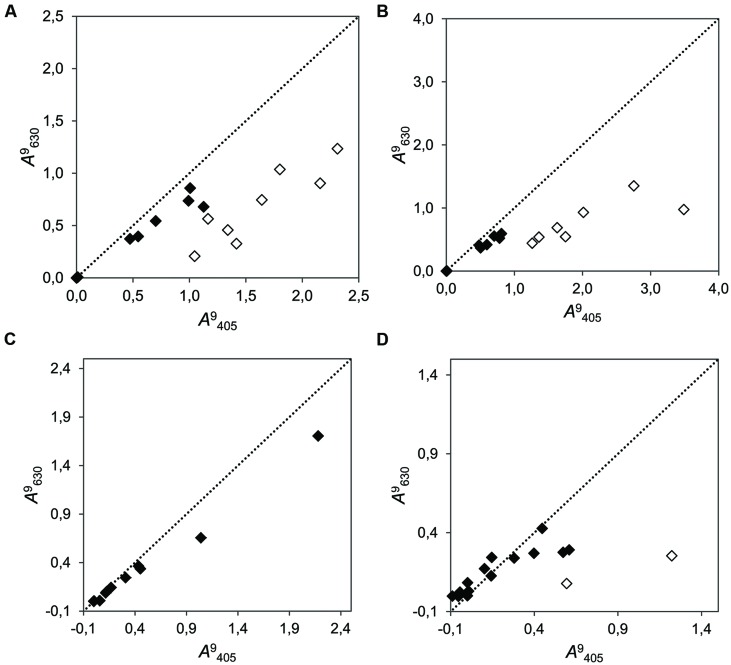
FIGURE 4.
Correlation plots of the cumulative growth (measured at λ = 405 nm vs. λ = 630 nm at time point 9 dai) of 15 fungi in media supplemented with four different phenolic compounds. (A) Chlorogenic acid (r2 = 0.683; b = 0.430); (B) Gallic acid (r2 = 0.788; b = 0.321); (C) Salicylic acid (r2 = 0.992; b = 0.460); and (D) (+)-catechin (r2 = 0.407; b = 0.240). The dotted line represents the bisector of slope b = 1. Dots close to this line produced even results when measured with both wavelengths (filled dots). Empty dots indicate strains in which an unexpected change of color to yellow–orange was visually evident. Note that it is not expected that points aggregate to the bisector, because the measurements at different wavelengths need not to be alike, regardless of the undesired color change.

