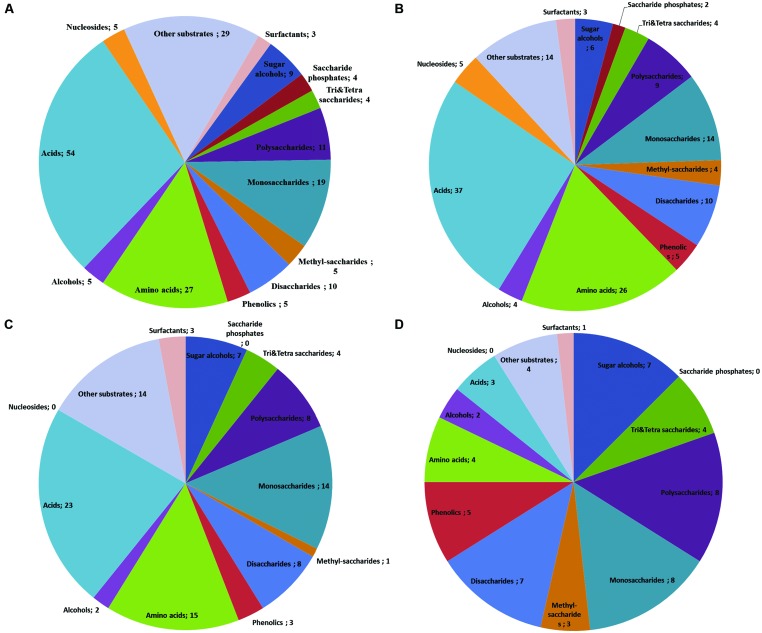
FIGURE 6.
Venn-diagrams show the utilization patterns of carbon sources (divided in chemical groups) of three fungi as indicated by the color development data on BIOLOG plates Phenotype MicroArray (PM) 1 and 2A. All available substrates divided in chemical groups (number of individual compounds after the semicolon; A). Substrate utilization pattern by the endophyte Monographella nivalis var neglecta – a strong in vitro competitor of the pathogen, occupying the same niches in the tree and utilizing carbon sources more efficient than the pathogen (B), the pathogen causing Dutch elm disease, O. novo-ulmi (C) and Aureobasidium pullulans (D), a ubiquitous fungus with no detected competitive relation to the pathogen in vitro (Data modified from Blumenstein et al., 2015).

