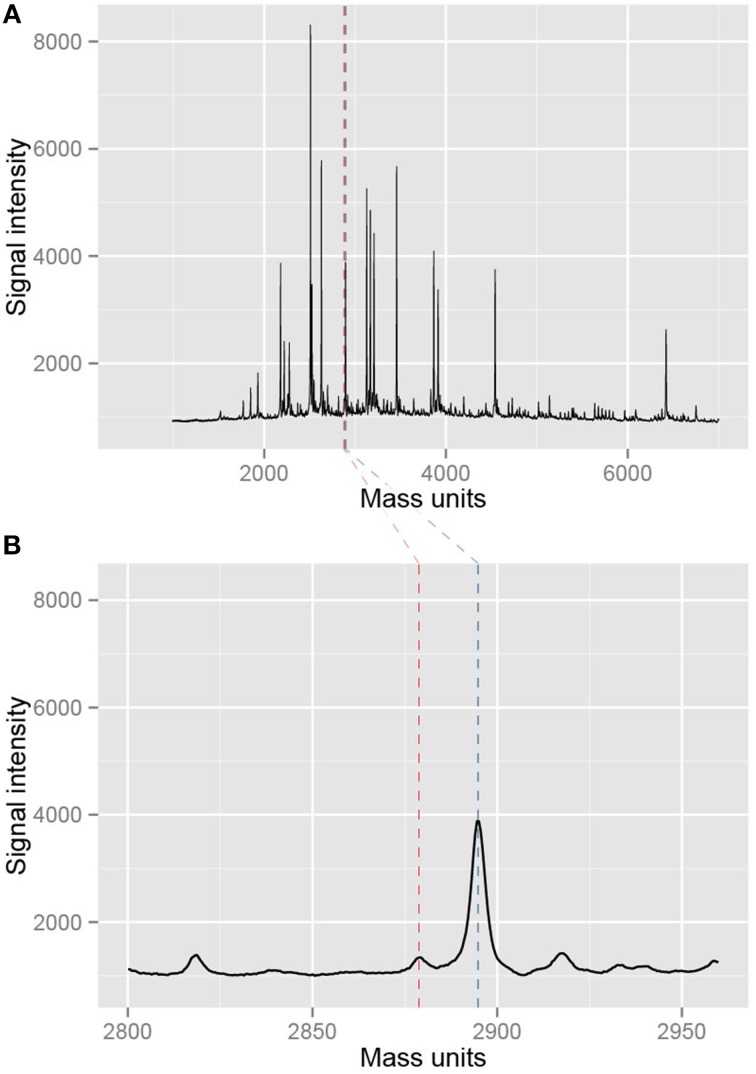
Figure 5.
Example of mass spectra resulting from the measurement with EpiTYPER. (A) Shows an entire mass spectrum of a single measurement of a sample. Black peaks are measured fragments while the blue and red dotted lines denote a selected CpG fragment in the EpiTYPER software. This particular part of the mass spectrum is shown in (B). The spectrum is nice and smooth, indicating a good quality of the measurement.

