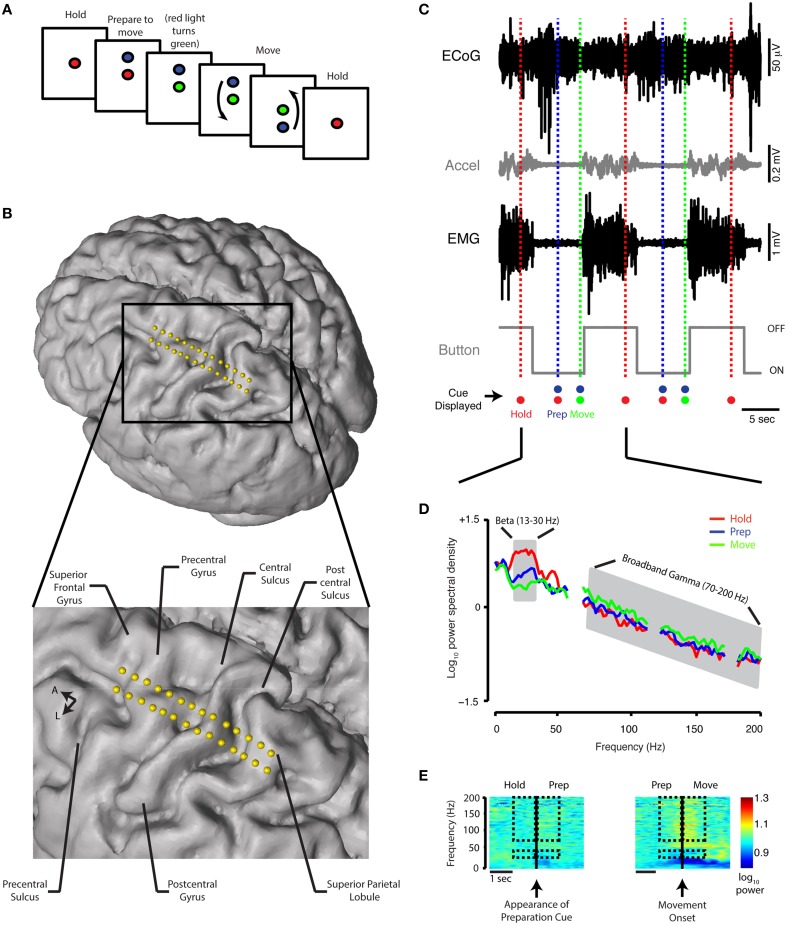
Figure 1.
Behavioral task, contact localization, examples of raw data recording, and spectral analysis. (A) Schematic of the reaching task. See Materials and Methods for detailed description. (B) Electrode positions relative to the brain anatomy of a single subject. The cortical surface was reconstructed offline using the preoperative MRI (Statistical Parametric Mapping 8, SPM8). Electrode coordinates (in relation to the midpoint of the line adjoining the anterior and posterior commissures) were then determined by co-registering the preoperative MRI and intraoperative CT scan and mapped onto the cortical surface. (C) A 30-s simultaneous recording of ECoG data (from precentral gyrus), accelerometer position, EMG potential, and button tracing from a single Parkinson's subject. The time scale beneath the button recording indicates 5 s. The recordings are shown in relation to the timing of the HOLD, PREPARATION, and MOVE periods during two trials. Accel, accelerometer; m, milli; sec, second; μ, micro; V, volt. (D) Power spectral density for the HOLD, PREPARATION and MOVE periods are superimposed [average of 20 trials, same subject as (C). The PSD curve for the REST period for this subject is nearly indistinguishable from the HOLD PSD curve and is not shown. Gray shaded areas indicate boundaries of the beta (13–30 Hz) and broadband gamma (70–200 Hz) frequency bands. (E) Spectrograms for task transitions, same ECoG data as depicted in (C). Hashed marks indicate the frequency bands (beta: 13–30 Hz and broadband gamma: 70–200 Hz) and intervals (1 s before and after the appearance of the blue filled circle and movement onset for the HOLD-PREP and PREP-MOVE transitions, respectively) over which spectrogram data are shown for comparison.

