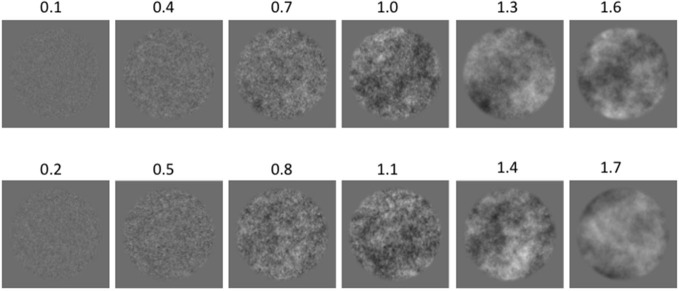
Figure 1.

Examples of 1/f amplitude-spectrum stimuli with increasing amplitude spectrum slopes (α): (top row) Series 1; (bottom row) Series 2. All example images have the same mean luminance and the same Root Mean Square (RMS) contrast of 0.25 for the purpose of illustration of stimulus patterns.
