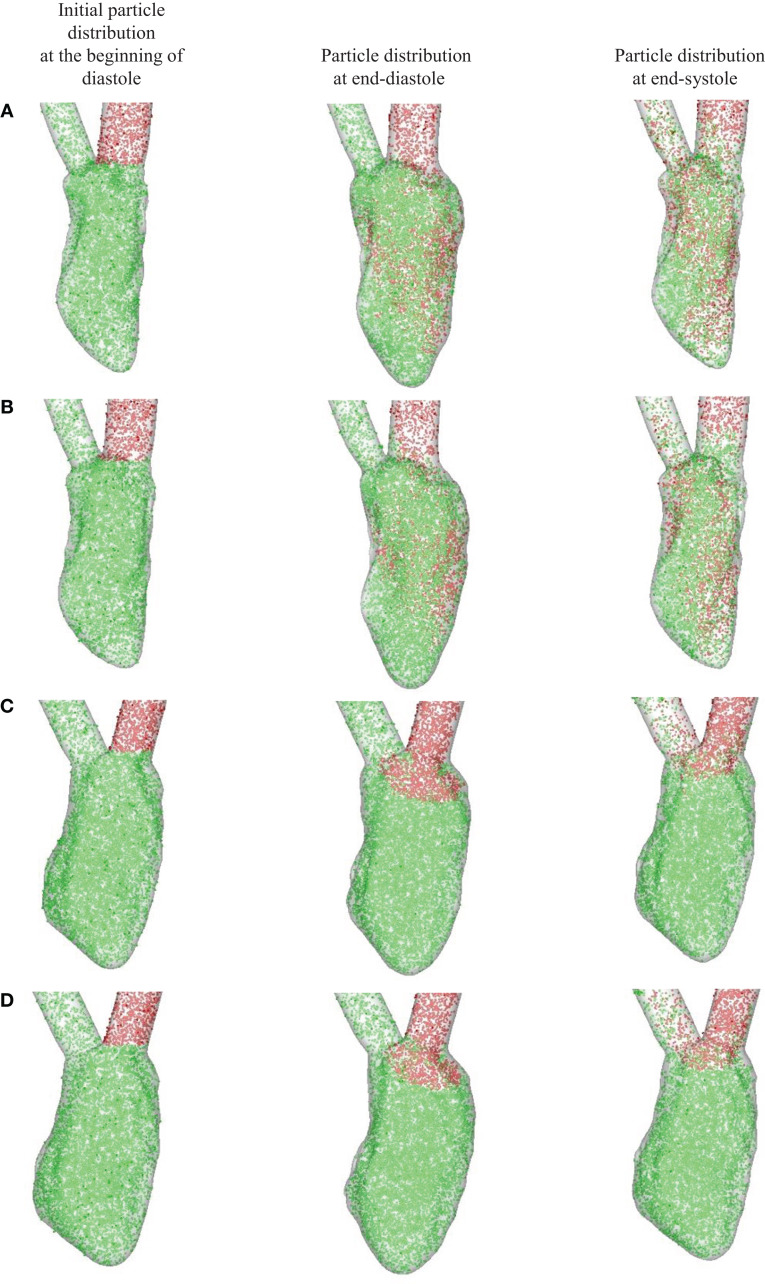
Figure 9.
Blood transport analyzed using Lagrangian particle tracking. Red and green dots represent the atrial and ventricular blood cells, respectively. (A) Normal heart with SR activation; (B) normal heart with LBBB activation; (C) failing heart with SR activation; (D) failing heart with LBBB activation. SR, sinus rhythm; LBBB, left bundle branch block.

