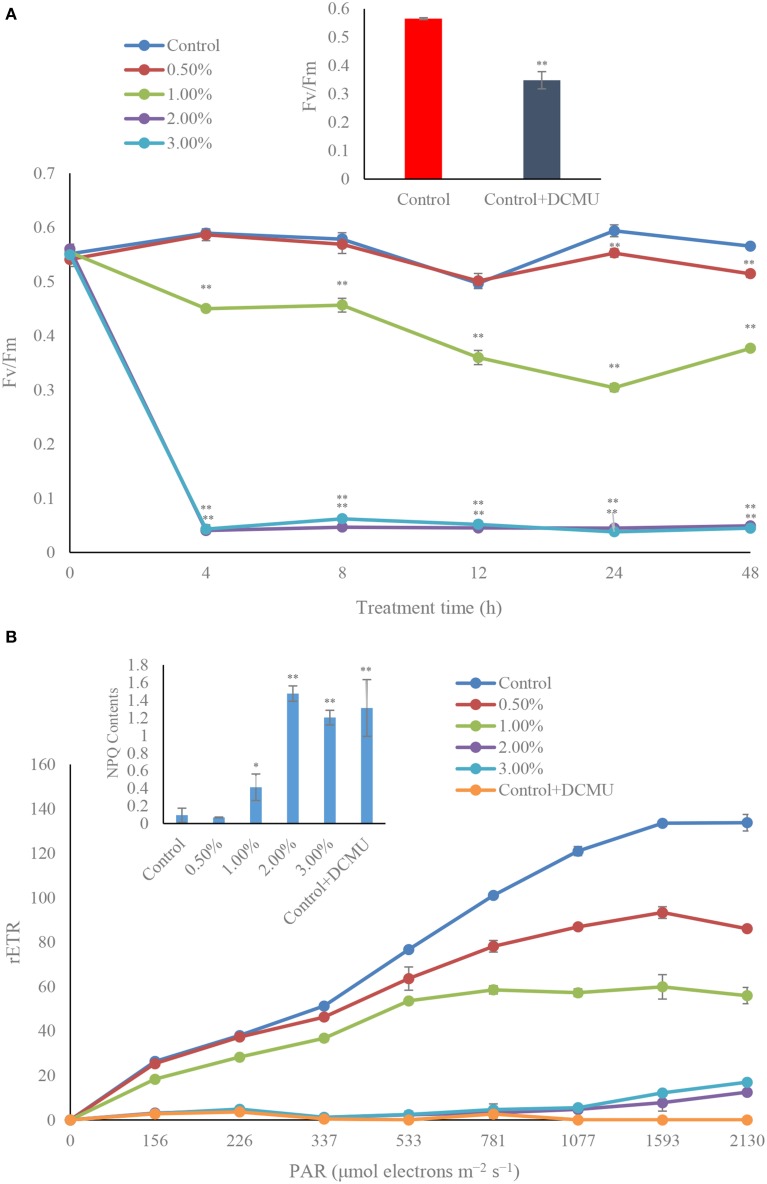
Figure 6.
Photosynthetic efficiency (Fv/Fm) (A), and photosynthetic capacity (rETR) exposed for 4 h (B) of A. tamarense treated with different concentrations of the bacterial culture. All error bars indicate the SE of the three biological replicates. *Represents a statistically significant difference of p < 0.05 when compared to the control; **represents a statistically significant difference of p < 0.01. DCMU concentration is 10 μM with incubation for 5 min. inset in (A) represents the Fv/Fm contents in algal cells after treated by DCMU; inset in (B) represents the NPQ contents in algal cells after treated by DCMU.

