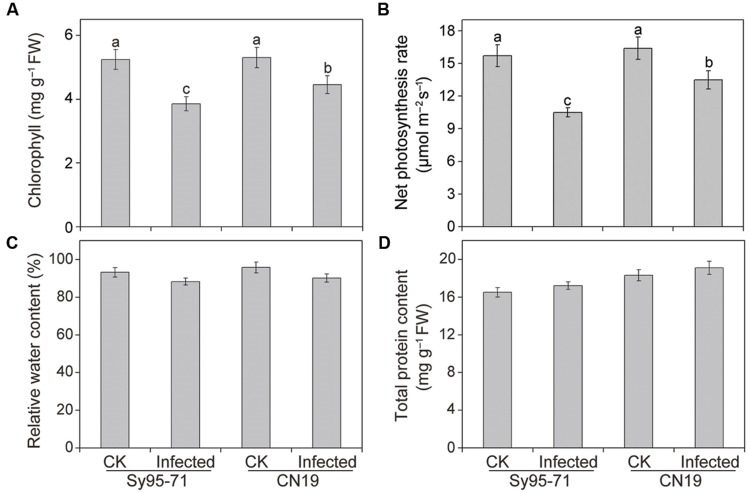
FIGURE 2.
Chlorophyll (A), net photosynthetic rate (B), relative water content (RWC) (C), and total protein content (D) in inoculated and un-inoculated leaves of Sy95-71 and CN19. Error bars represent the standard deviation based on three biological replicates. Different letters depict significant differences between the susceptible and resistant wheat cultivars (P < 0.05). Statistical analysis was performed using one-way ANOVA followed by Duncan’s multiple range test. CK, un-inoculated wheat plants.

