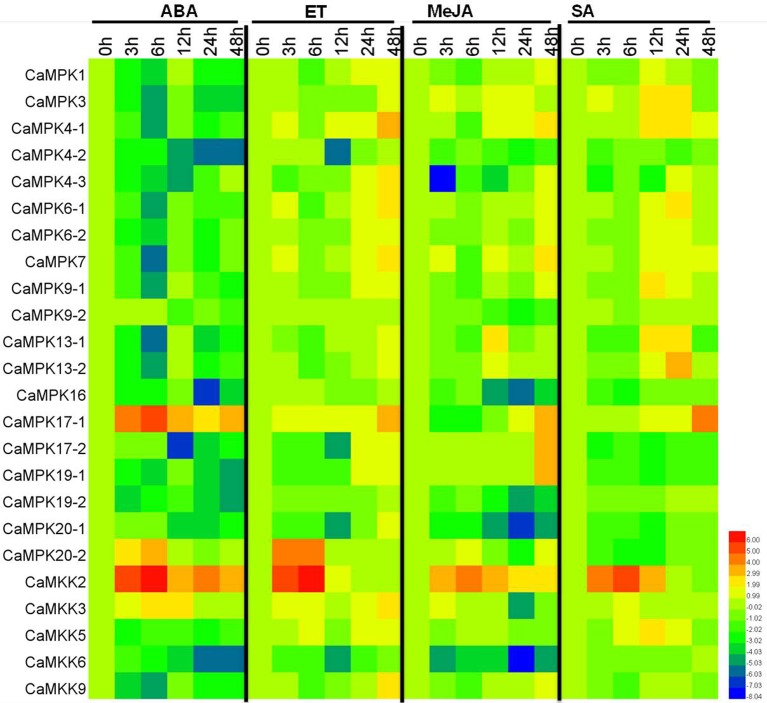
Figure 10.
Heat maps showing the expression patterns of the MAPKs and MAPKKs in pepper in response to phytohormones. The expression patterns of MAPKs and MAPKKs in response to ABA (100 μM), ETH (100 μM), MeJA (100 μM), and SA (1 mM). The relative expression (the mean fold changed between treated and control samples at each time points ± standard deviations) was log2 transformed. Each value represents the mean relative level of expression of three replicates. Blue represents low expression, red represents high expression. The heat map was generated using the software HemI.1.0.1.

