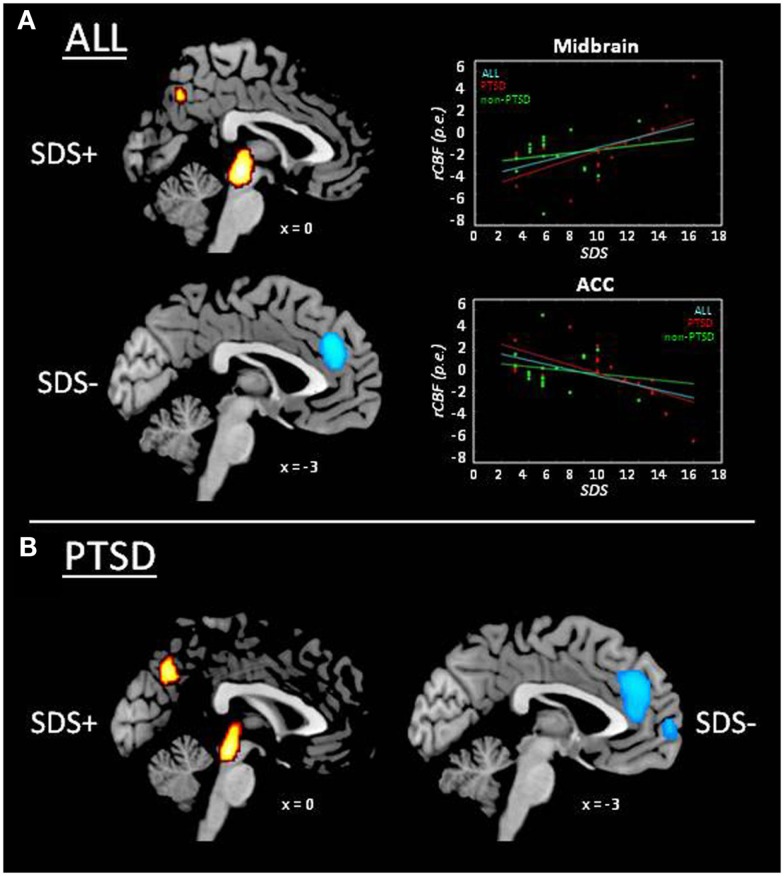
Figure 2.
Whole-brain results of the analysis on SPECT data: correlation between rCBF and sleep disturbances score (SDS; cf. Table 3). rCBF increase associated with higher sleep disturbances (SDS+) is displayed in red/yellow and rCBF decrease with higher sleep disturbances (SDS−) in light blue. (A) Whole group of subjects (i.e., irrespective of PTSD diagnosis; n = 37). Scatter plots display rCBF as a function of SDS in the whole group (cyan line; r = ±0.51; p = 0.001), and separately for PTSD (red line/diamonds; r = ±0.68; p = 0.001) and non-PTSD (green line/dots; r = ±0.17; p = 0.511), expressed as parameter estimates (p.e.; values extracted at peaks in the midbrain and anterior cingulate cortex). (B) PTSD group.

