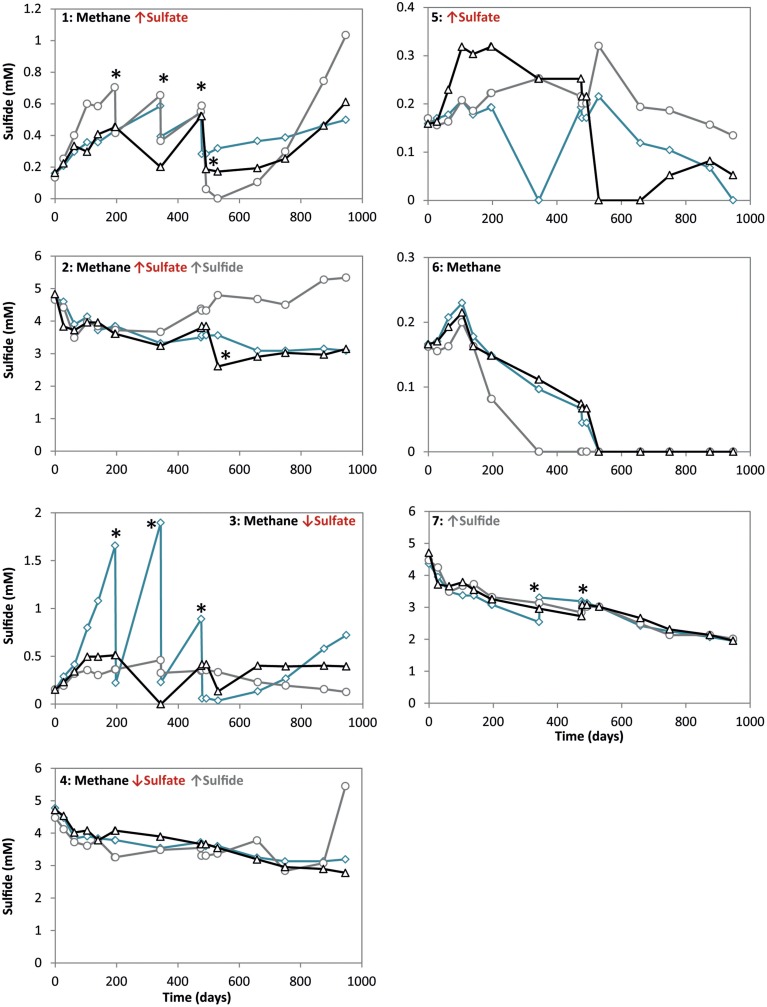
Figure 1.
Sulfide concentrations during 947 days of incubation in all conditions. Arrows indicate either high (↑) or low (↓) sulfate and sulfide concentrations. The time points where either ferrous sulfate or sodium sulfate was added are indicated by an asterisk. Different lines represent triplicate incubations (A, blue diamonds; B, grey circles; C, black triangles).

