
Figure 1.
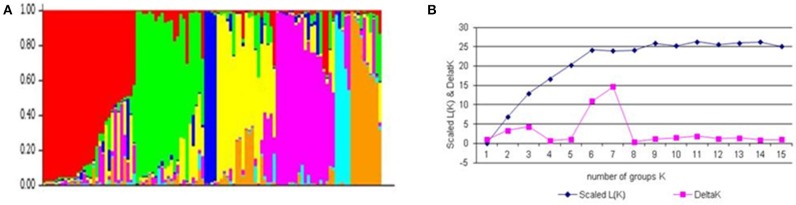
Population structure of association mapping pannel based on unlinked SNP marker. (A) Plot of the scaled average logarithm of the probability of data likelihood [LnP (D)] and delta K (ΔK) with K allowed to range from 2 to 15. (B) Membership co-efficient (Q-value) where each horizontal line represents one wheat line and partitioned into seven sub-populations.