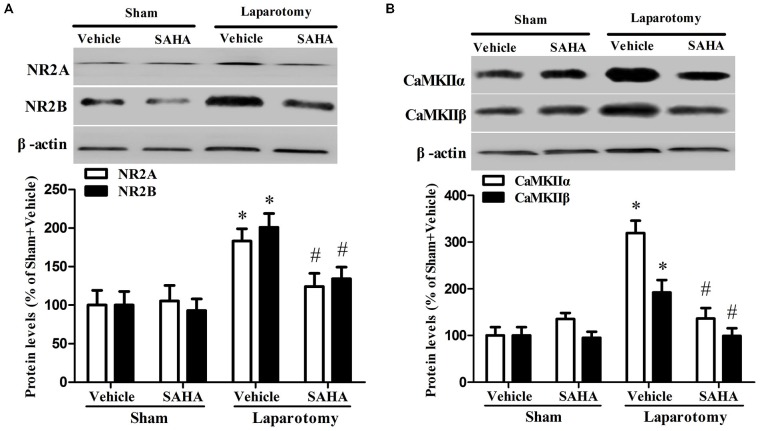
Figure 6.
Impact of SAHA treatment on protein expressions of NR2A, NR2B, CaMKIIα, and CaMKIIβ in the 16-month old mice after surgery. (A) The protein levels of NR2A, NR2B were determined by western blot. Representative image is shown at the top and quantitative result at the bottom. Data are presented as the mean ± S.E.M. (n = 3). (B) The protein levels of CaMKIIα and CaMKIIβ. Representative image is shown at the top and quantitative result at the bottom. Data are presented as the mean ± S.E.M. (n = 3). *p < 0.05 compared with the Sham + Vehicle group; #p < 0.05 compared with the Laparotomy + Vehicle group.

