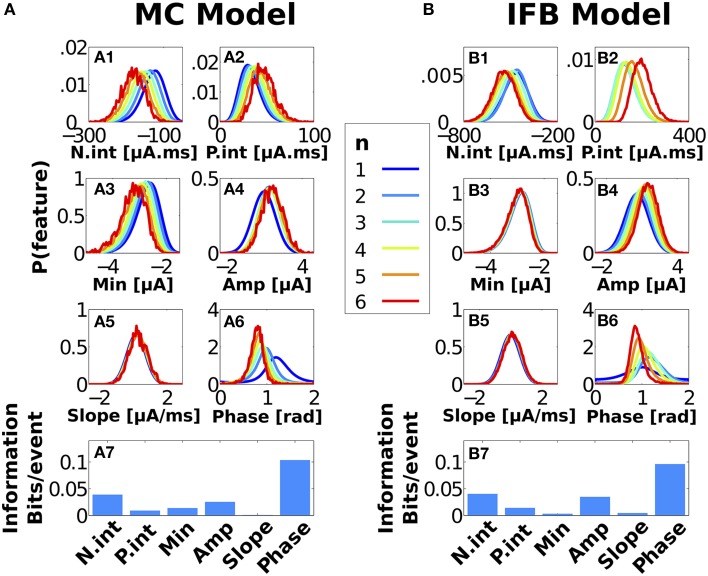
Figure 5.
Probability density functions of stimulus features triggering bursts of n spikes and associated information, for MC (A) and IFB (B) models. Instantaneous stimulus features (A1–A6, B1–B6), with the same color code as in Figure 3 (see key). For better visualization, distributions are plotted with a resolution of M = 256 bins. Information values (displayed in A7, B7) were calculated with a coarser binning M = 32 to reduce estimation bias.

