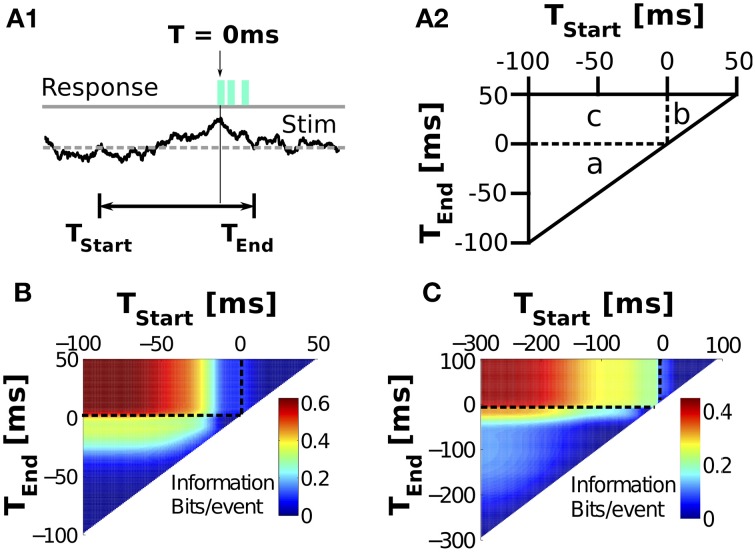
Figure 8.
Dependence of the encoded information on the location of the window used to define the stimulus. (A) Explanatory diagrams illustrating the definition of the windows (A1), and the subdivision of maps (A2) into regions: Stimuli may be taken entirely before (A2 a), after (A2 b), or astride (A2 c) burst onset (T = 0). Vertical dashed black lines mark Tstart = 0 ms and horizontal lines represent Tend = 0 ms. (B, C) Information between n and V1-projected stimuli is color-plotted as a function of the location of the times Tstart and Tend of the window, for the MC (B) and the IFB models (C). Models were driven with stimuli with σOU = 1μA, τOU = 5 ms, μOU = 0μA. Information is calculated with digitization of M = 32 bins and shuffle-corrected to account for bias.

