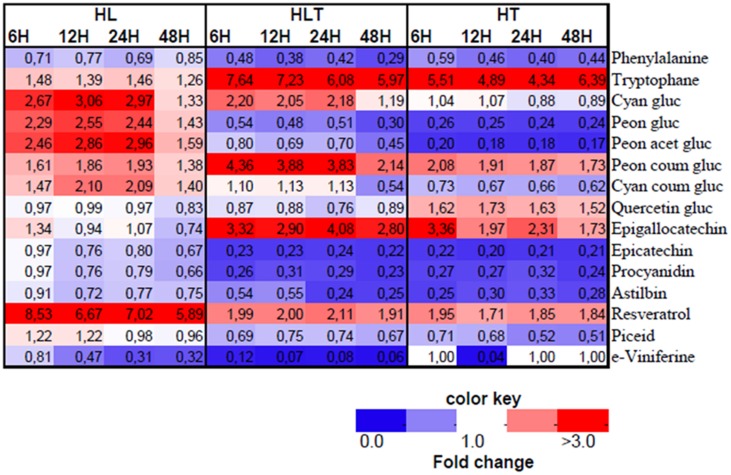
FIGURE 4.
Heatmap of annotated LC–MS based metabolites in fold change from respective time point control. Treatments exposed to HL = 2500 μmol m-2s-1 light intensity, HT = 40°C, HLT = HL with HT for 4, 8, 12, and 48 h. Different colors represent the increase (red) or decrease (blue) of the metabolites fold change as indicated in the color key. Mean values are presented (n = 4).

