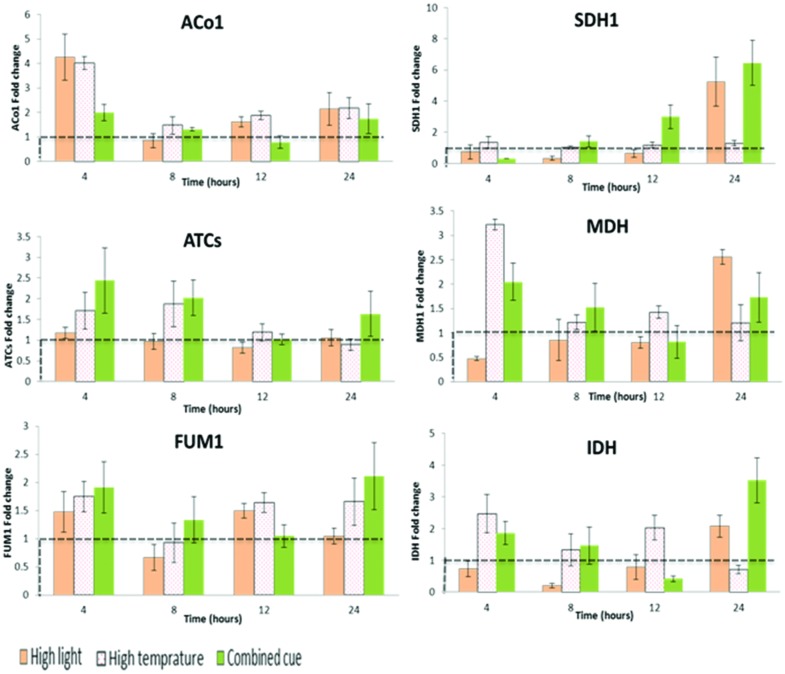
FIGURE 6.
Fold change in transcript levels of TCA cycle mediating enzymes from respective time point control. Fold change values between zero and one (below the dashed line) indicates lower transcrip level compared to the control. ACo1, Aconitate hydratase 1-like; SDH1, Succinate dehydrogenase; ATCs, Citrate synthase; MDH, Malate dehydrogenase; FUM1, Fumarate hydratase; IDH, Isocitrate dehydrogenase; n = 3, mean values ±SE.

