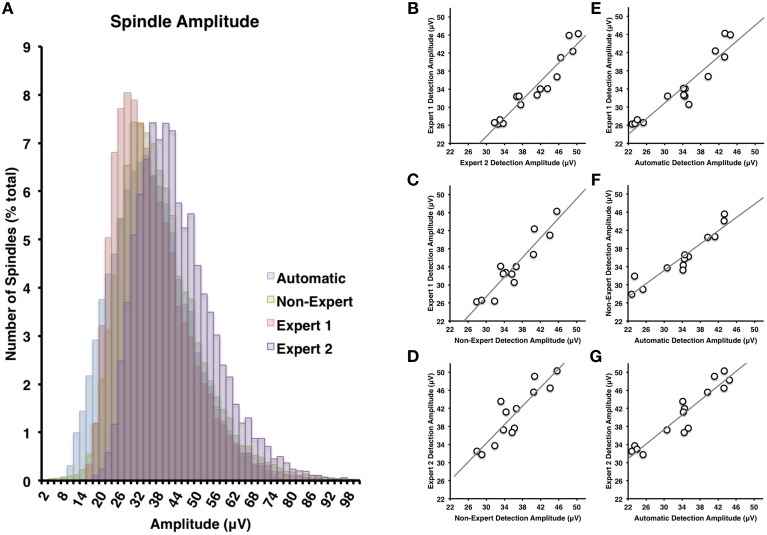
Figure 4.
(A) There was the greatest deal of overlap between non-experts and the automatically detected spindles in terms of spindle amplitude (Cohen's d = 0.24), but less overlap between the non-experts and Expert 1 (Cohen's d = 0.85) or Expert 2 (Cohen's d = 0.63). Spindle amplitudes of automatically detected spindles were generally smaller than Expert 2 (Cohen's d = 0.68) and overlapped the most with Expert 1 (Cohen's d = 0.05). Spindle amplitude among visual identification methods (B–D) and between automatic and visual detection (E–G) were all highly inter-correlated (all p < 0.05).

