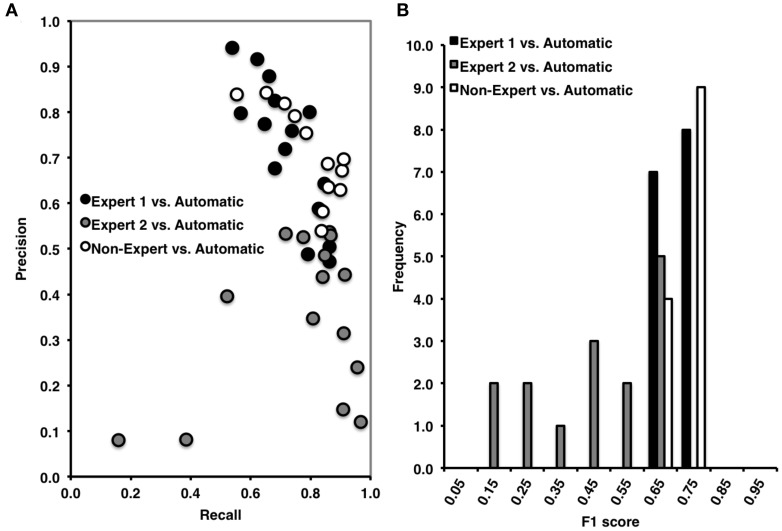
Figure 6.
(A) High precision and recall across recordings when comparing automated to Expert 1 spindle scoring (black) and to non-experts (open), but low precision and high, but variable recall when comparing Expert 2 to automatic spindle detection (gray). (B) Inter-rater agreement was consistently high across recordings scored by Expert 1 vs. automatic detections, ranging from 0.60 to 0.80 (Mean F1 = 0.71, ±0.06) and in non-experts vs. automatic detection, ranging from 0.60 to 0.80 (F1 = 0.73, ±0.04), but was low and variable between Expert 2 and the automatic detection, ranging from 0.10 to 0.70 (Mean F1 = 0.49, ±0.04). F1 score = harmonic mean of recall and precision.

