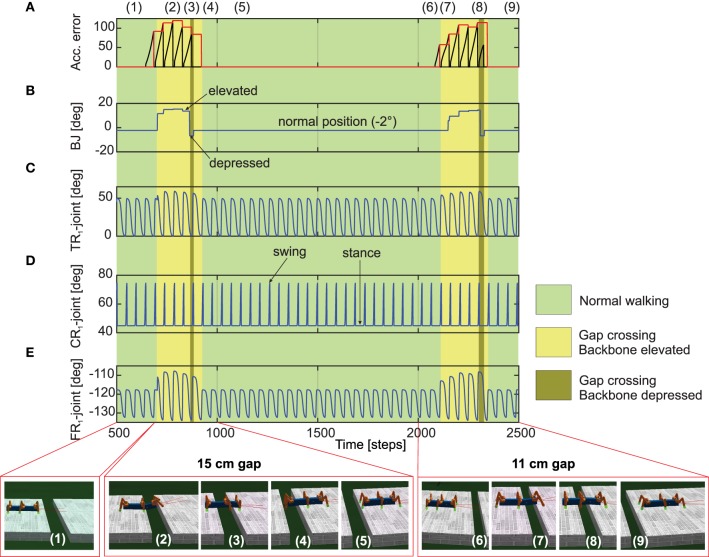
Figure 7.
Real-time data of walking and crossing multiple gaps using the forward model predictions. (A) The accumulated error (black line) and the maximum accumulated error value at the end of each stance phase (red line) of the right front leg (R1). The accumulated error is reset to zero every swing phase. (B) The backbone joint (BJ) angle during walking and gap crossing. The BJ stays at the normal position (−2°) during normal walking. On encountering a gap (15cm), it leans upwards in a step like fashion and then finally bent downwards in order to cross the gap. This procedure is repeated for the second gap (11cm), however with different degree of elevations. (C–E) The TC-, CTr-, and FTi-joint angles of right front leg R1 during normal walking and gap crossing. The joint adaptation was controlled by the maximum accumulated error value of the previous step (red line). Below pictures show snap shots of the locomotion of AMOS II during the experiment. Note that one time step is ≈0.037 s. For further details interested readers are recommended to see the experiment Supplementary Videos 1, 2.

