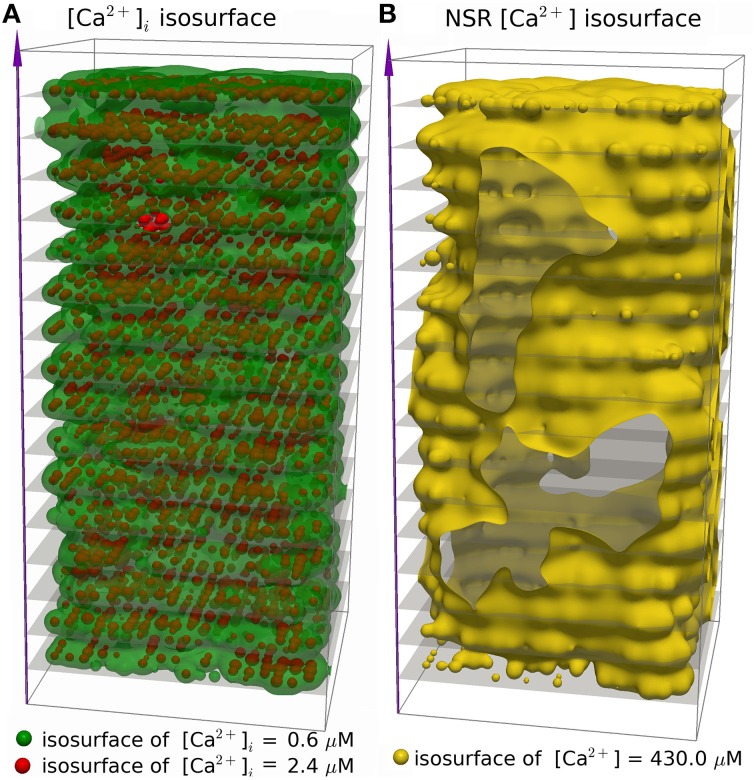
Figure 7.
Three dimensional visualization of spatially resolved [Ca2+] at 70.0 ms after activation, using the (Walker et al., 2014)-RyR-model. (A) Isosurfaces show [Ca2+]i in green for [Ca2+]i = 0.6 μM and red for [Ca2+]i = 2.4 μM. (B) The yellow isosurface shows free SR-[Ca2+] = 430 μM. There are 320 CRU per z-disc, amounting to 5160 CRUs in total, with an average of 50 RyR and 12.5 LCC per CRU. See Supplementary Movies 1, 2 for the evolution of [Ca2+]i and nSR [Ca2+] through an AP.

