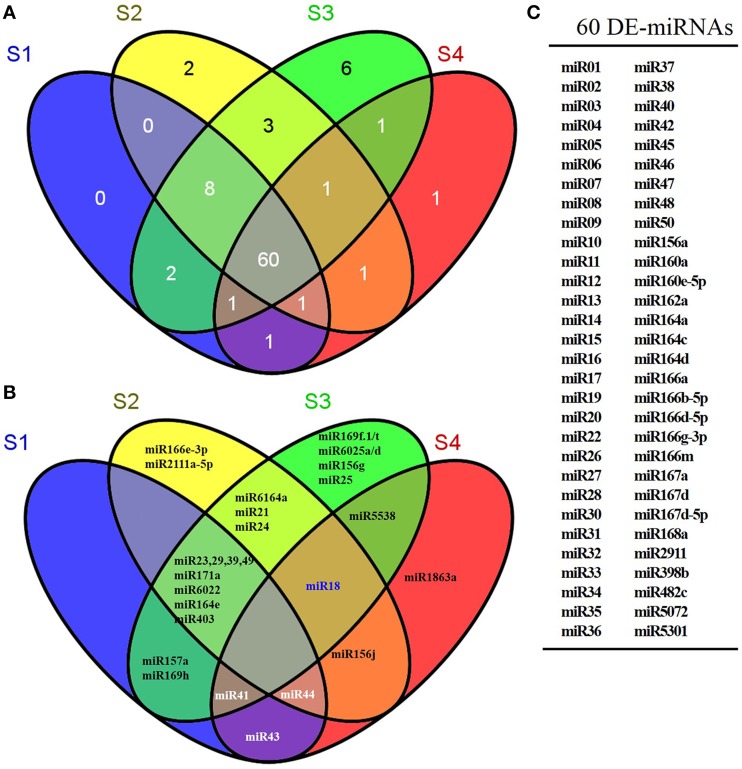
Figure 3.
Venn distribution of differentially expressed miRNAs in ripening fruit samples. (A) showed the number of differentially expressed miRNA in ripening fruits. (B) showed the exact miRNA(s) differentially expressed in ripening fruits. (C) indicated that the 60 miRNAs differentially expressed in all ripening fruit samples. The differentially expressed Lycium barbarum miRNAs were defined as following the criteria of q < 0.01 and |log2(foldchange)| > 1 based on the number of miRNA reads in small RNA libraries.

