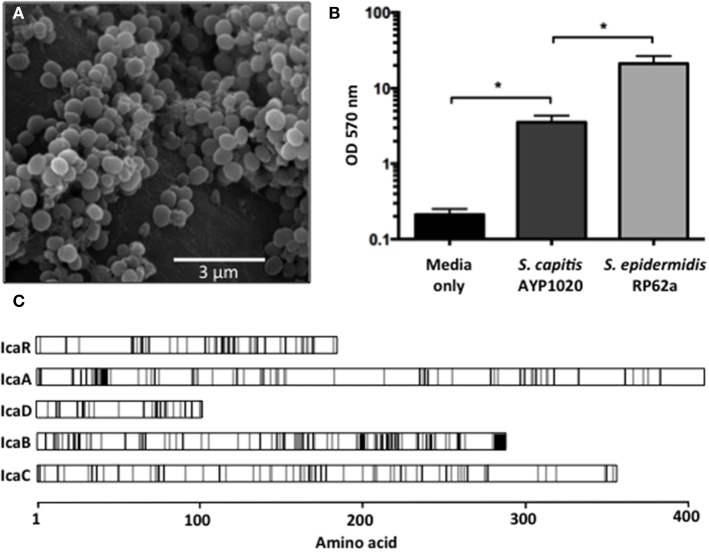
Figure 4.
Biofilm formation of S. capitis AYP1020. Scanning electron micrograph of biofilm formed by S. capitis AYP1020 on polyurethane at 10,000X magnification (A). Biofilm was quantified on polystyrene microtitre plates. Data are expressed as mean ± SEM (*P < 0.05) (B). Schematic ClustalW alignment revealed high similarity (71–83% identity) between the IcaRADBC proteins of S. capitis AYP1020 and those of S. epidermidis. White regions represent the same amino acid, gray regions represent similar amino acids and black regions represent non-similar amino acids (C).

