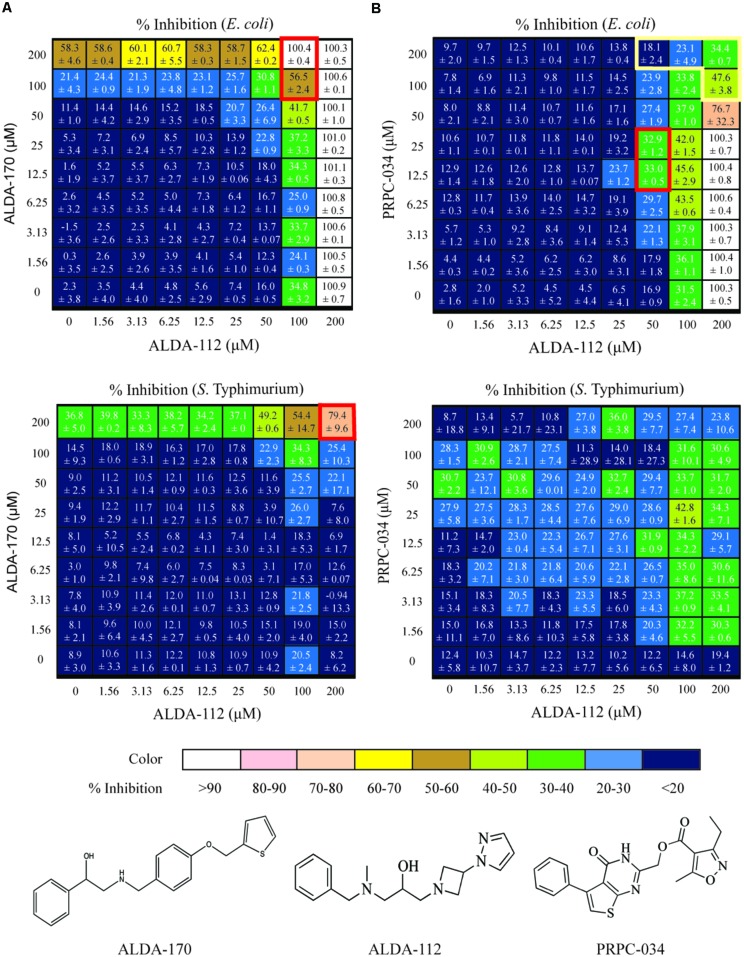
FIGURE 4.
Dose response matrix for ALDA-112/ALDA-170, and ALDA-112/PRPC-034 against E. coli and S. Typhimurium. The single agent effects are depicted in the far left column and along the bottom row of each matrix. Each square represents a unique combination of the indicated compounds, and the number represents the level of growth inhibition that was measured plus standard deviation. (A) The ALDA-112/ALDA-170 pair exhibits mostly additivite inhibition against both E. coli and S. Typhimurium, with synergy at 100–200 μM concentration (red boxes). (B) Likewise, ALDA-112/PRPC-034 primarily exhibits additive inhibition at most concentrations against E. coli but there is one region of synergy (red box) and another region of antagonism (yellow box). No discernible pattern against S. Typhimurium is observed.

