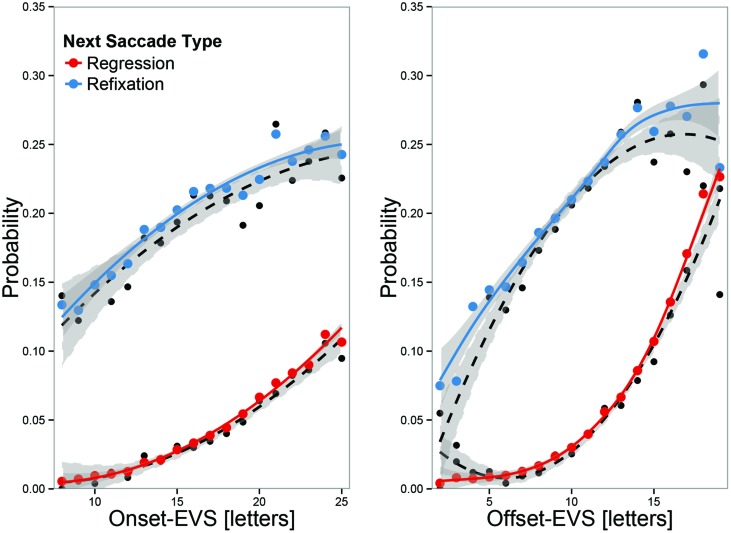
FIGURE 3.
Regression and refixation probabilities as function of EVS at fixation onset (left) and offset (right). Black dots represent overall means, and colored dots predicted means, adjusted for random effects. The lines represent second-order polynomial regression fits (black dotted) or GLMM fits (colored, solid). EVS at fixation onset is already predictive of an upcoming regression or refixations, but offset-EVS is more predictive. When EVS was large at offset, there was a high likelihood of making a regression.

