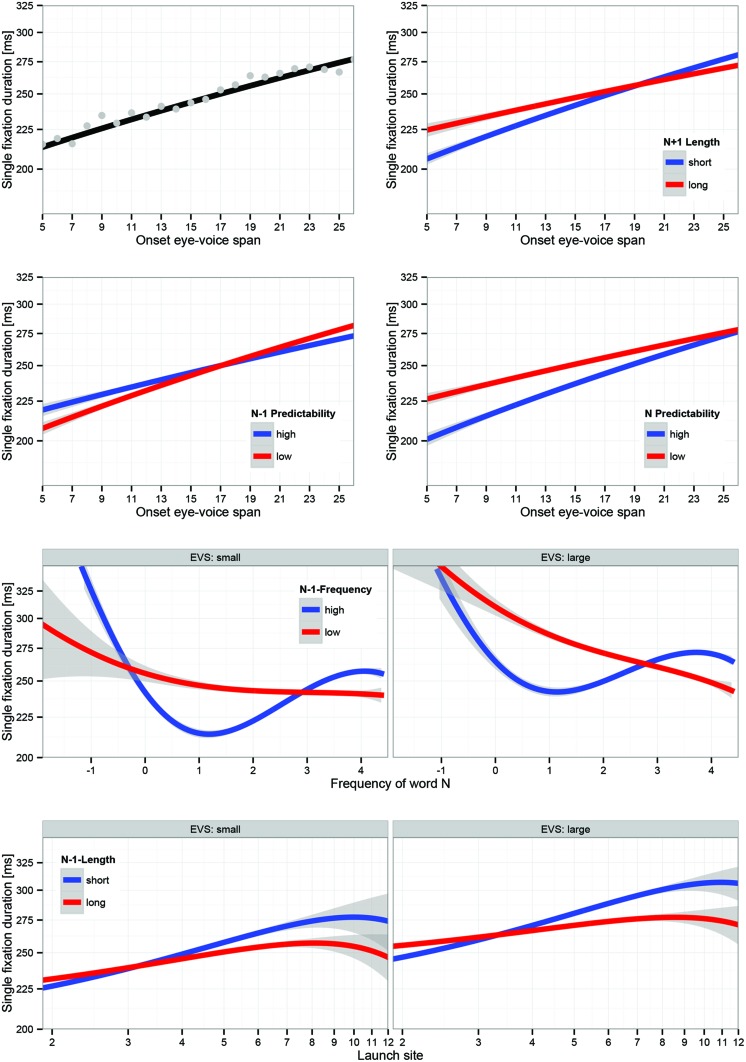
FIGURE 4.
Visualization of LMM estimates of main effect of onset EVS and three EVS-related interactions; LMM used three continuous covariates. Top left : main effect of EVS; dots are observed mean SFDs at levels of EVS; top right : EVS × N+1 length interaction; second row, left : EVS x N-1 predictability; second row, right : EVS × N predictability; third row : EVS × N-frequency × N-1-frequency; bottom row : EVS × launch site × N-1 length. Factors in panels are based on median splits for visualization; LMM estimation used continuous covariates. Error bands represent 95% confidence intervals based on LMM residuals. Effects are plotted on a log-scale of fixation durations, thus they show the backtransformed effects as they were estimated in the LMM.

