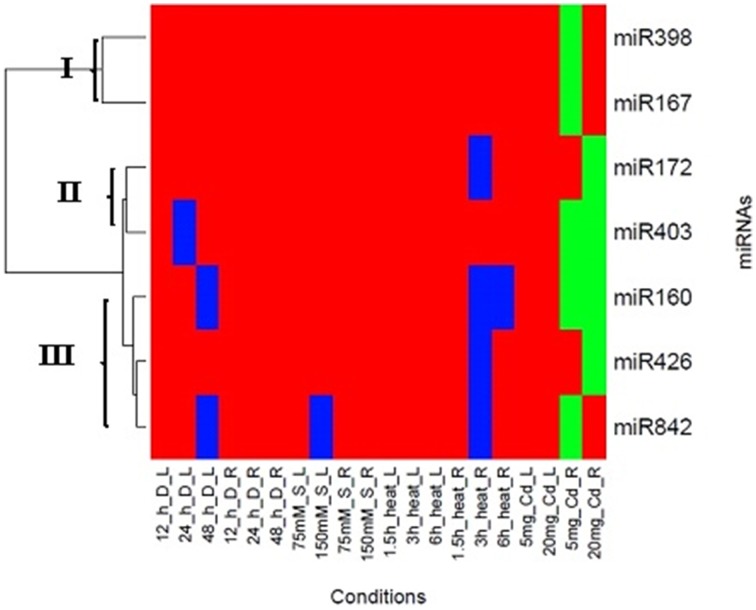
Figure 5.
Clustering of miRNAs expression profiles. Heat map diagram of miRNA expression prepared with two-way unsupervised hierarchical clustering of miRNAs expression under different abiotic stress. miRNAs are given in the rows and each columns represent a sample. The miRNA clustering tree is shown on the left (cluster I, II and III). Abbreviations: L, Leaf; R, Root; h, Hour; D, Drought stress; S, Salt Stress; Cd, Cadmium stress.

