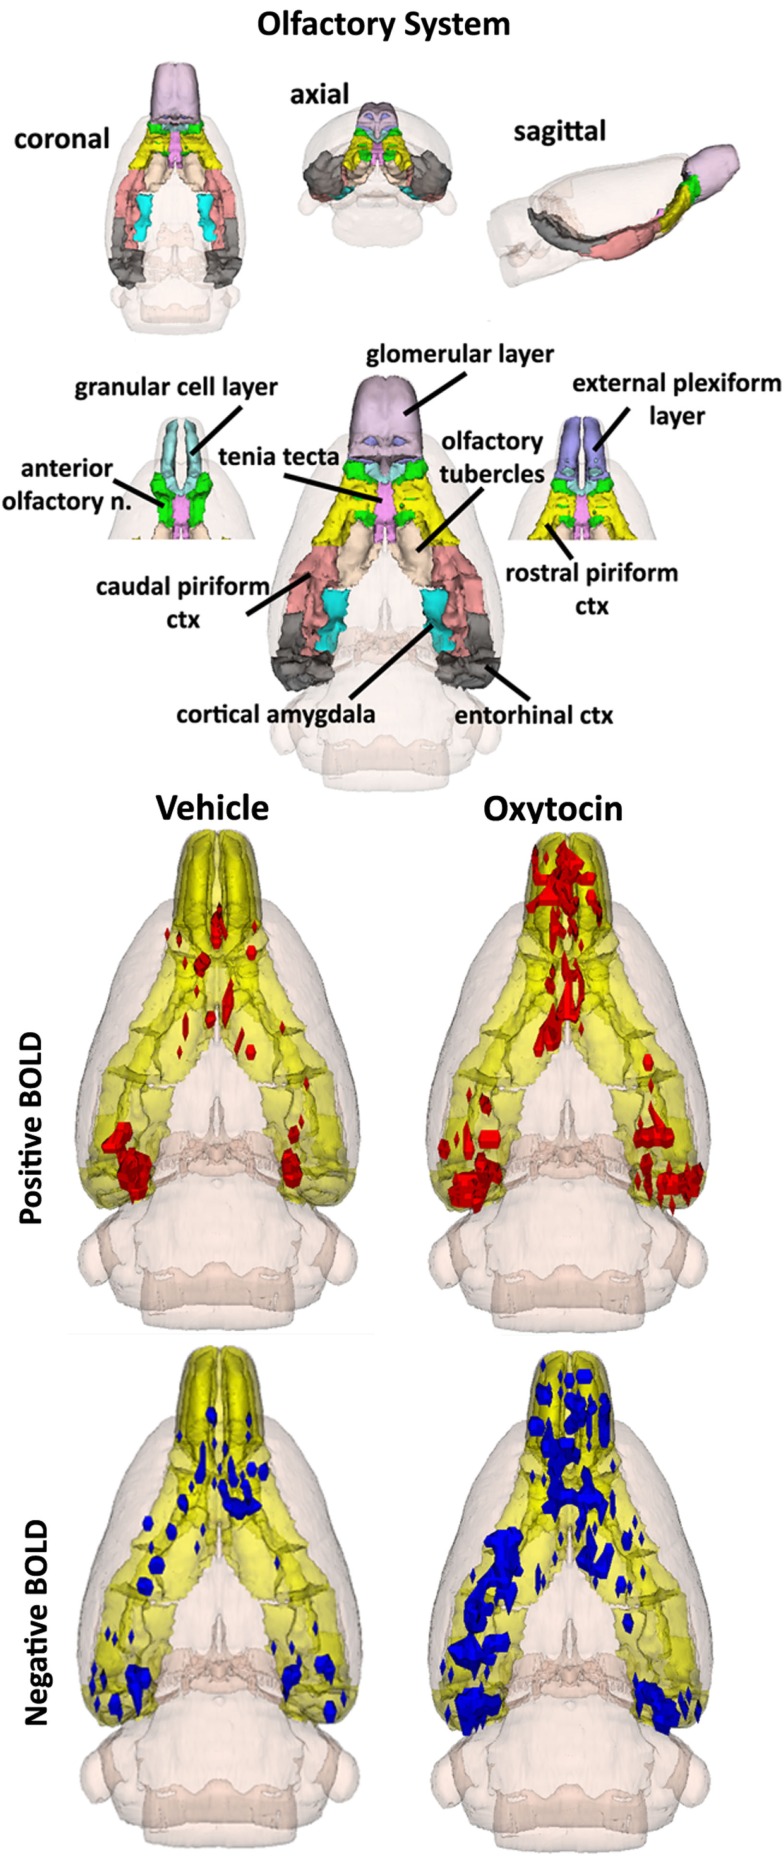
Figure 4.
The 3D color model at the top depicts the location of the brains that comprise the primary olfactory system in the rat. These areas have been coalesced into a single volume (yellow) as shown in the lower 3D images for intraperitoneal OT (n = 12) and vehicle (n = 12). Areas in red (positive BOLD) and blue (negative BOLD) are the localization of the significantly changed voxels comprising the composite average from the rats in each experimental group.

