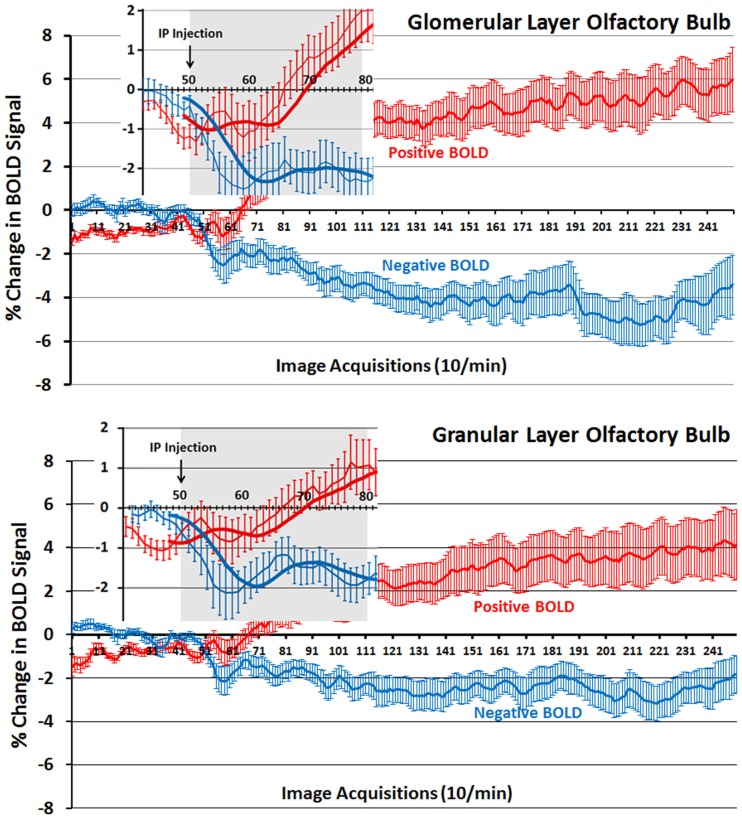
Figure 6.
Time-course plots for positive and negative BOLD in the olfactory bulb. Shown are the changes in positive (red) and negative (blue) BOLD signals over time in the glomerular and granular layers of the olfactory bulb following intraperitoneal injection of OT. The insert is a magnified cut-out of the 3 min following injection. The thick lines show trend lines as an average of eight acquisitions. Vertical bars denote SEM.

