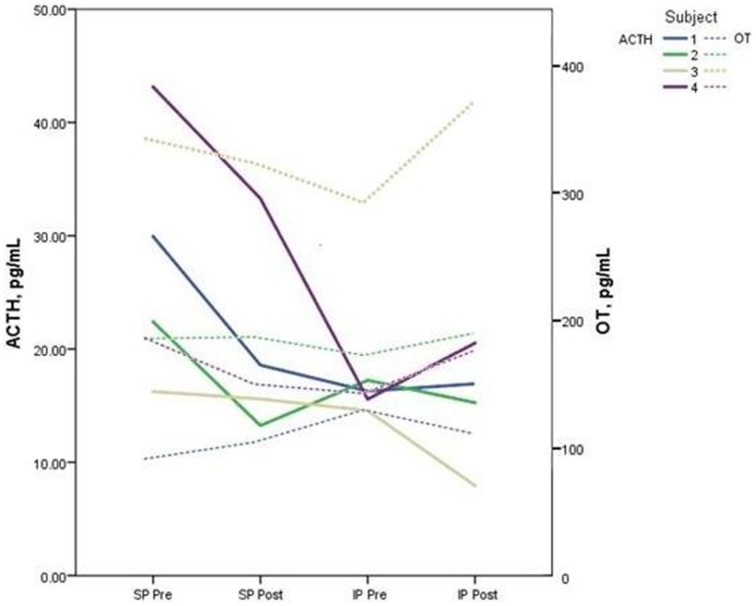
Figure 4.
The figure depicts the relationship between plasma adrenocorticotropic hormone (ACTH) and oxytocin (OT) concentrations for each subject measured during pre and post-tests of the standard performance (SP) and improvised performance (IP). An inverse relationship between neuropeptide levels is demonstrated in 3 out of 4 subjects.

