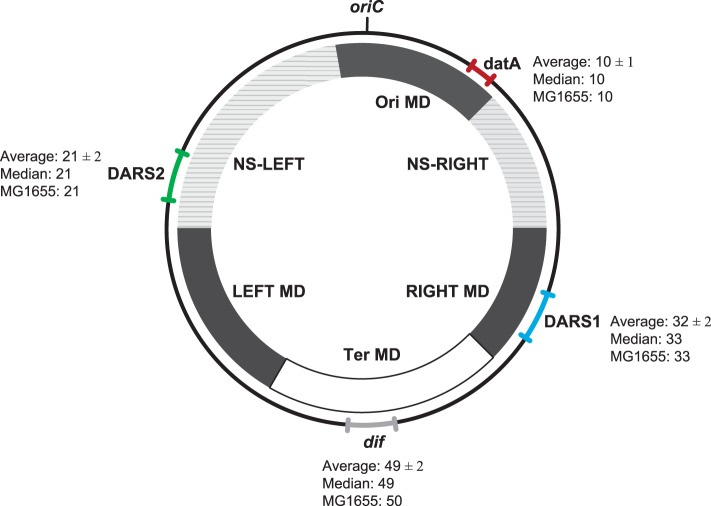
Figure 2.
Location of datA, DARS1, DARS2, and dif regions on the E. coli genomes. The range (the relative distance ± the standard deviation in centisomes) in the chromosomal position of datA (red), DARS1 (blue), DARS2 (green), and dif (gray) are shown in the outer circle. For each region the average relative distance with the standard deviation (see Materials and Methods), the median, as well as the chromosomal position in MG1655 (MG1655) are indicated. All distances are given in centisomes. The inner circle schematically shows the location of the different MD- and NS-regions as indicated by Esnault et al. (2007).

