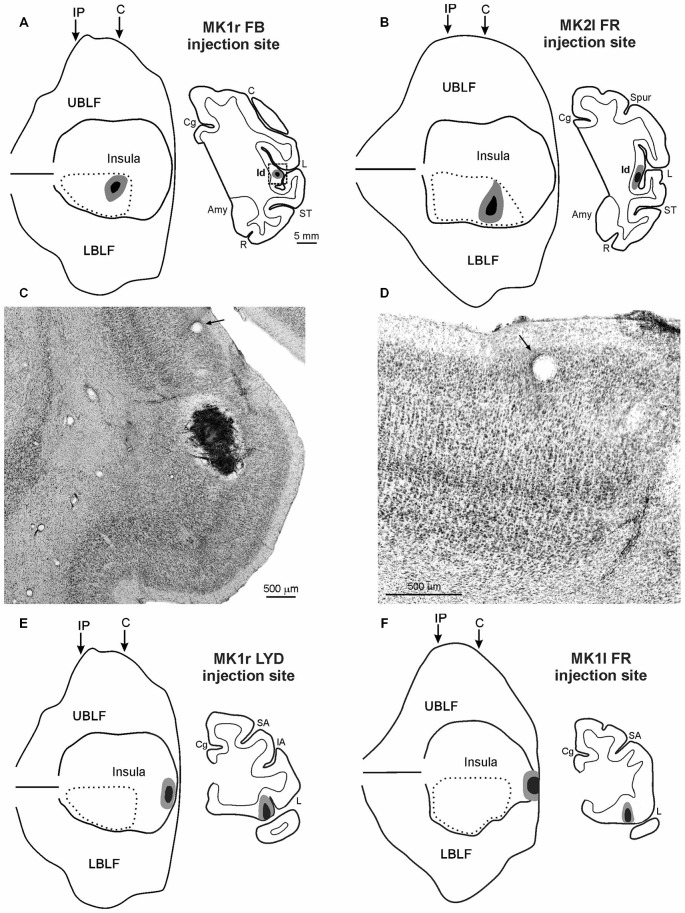
Figure 1.
(A,B,E,F) Injection sites shown in 2D reconstructions of the LF and in drawings of the sections. Each 2D reconstruction was aligned to correspond with the middle of the insula; the continuous lines mark the lips of the sulcus, the border of the insula with the upper and lower bank of the sulcus, and the fundus. The dashed lines indicate the region containing all the microstimulations that evoked an affiliative response. Arrows mark the levels of the rostral tip of the intraparietal sulcus (IP) and of the rostralmost level of the central sulcus (C). The location of each tracer injection is shown as a black zone corresponding to the core, surrounded by a gray zone corresponding to the halo. (C) Low-power photomicrograph of Nissl-stained coronal section shown in (A). The dashed box in the section drawing indicates the location of the photomicrograph. (D) Higher magnification view of the photomicrograph shown in (C). Arrows in (C,D) indicate the same blood vessel. Scale bars in (A) apply also to (B,E,F). Amy, amygdala; C, central sulcus; Cg, cingulate sulcus; IA, inferior arcuate sulcus; L, lateral fissure; LBLF, lower bank of the LF; R, rhinal sulcus; SA, superior arcuate sulcus; ST, superior temporal sulcus; UBLF, upper bank of the LF.

