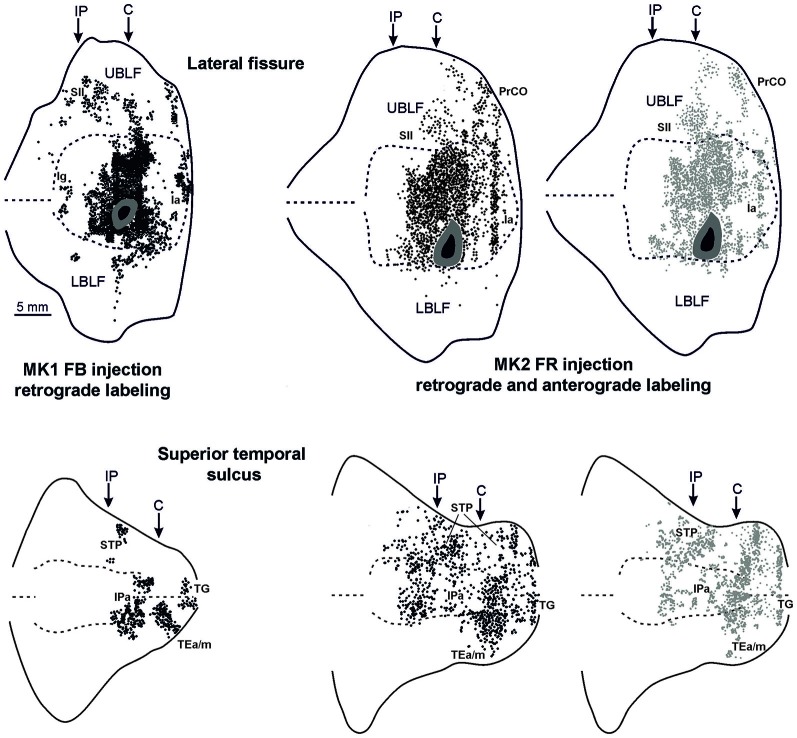
Figure 4.
Distribution of the retrograde and of the retro-anterograde labeling observed after injections of FB in case MK1 and of FR in MK2, respectively, shown in a 2D reconstruction of the LF (upper part) and of the STS (lower part). For the retrograde labeling, each black circle corresponds to one labeled neuron, and for the anterograde labeling, the gray circle density is proportional tso the density of the observed labeled terminals (one gray circle is equivalent to about 15–25 labeled terminals). Each 2D reconstruction of the LF was aligned to correspond with the middle of the insula. The dashed lines indicate the fundus and the upper and lower edges of the floor, the continuous lines the lips of the sulcus. Each 2D reconstruction of the STS was aligned to correspond with the fundus and middle of the floor. The dashed lines indicate the fundus and the border of the insula with the upper and lower bank of the sulcus, the continuous lines the lips of the sulcus. Arrows mark the levels of the rostral tip of the intraparietal sulcus (IP) and of the rostral most level of the central sulcus (C). Other conventions and abbreviations as in Figures 1, 2.

