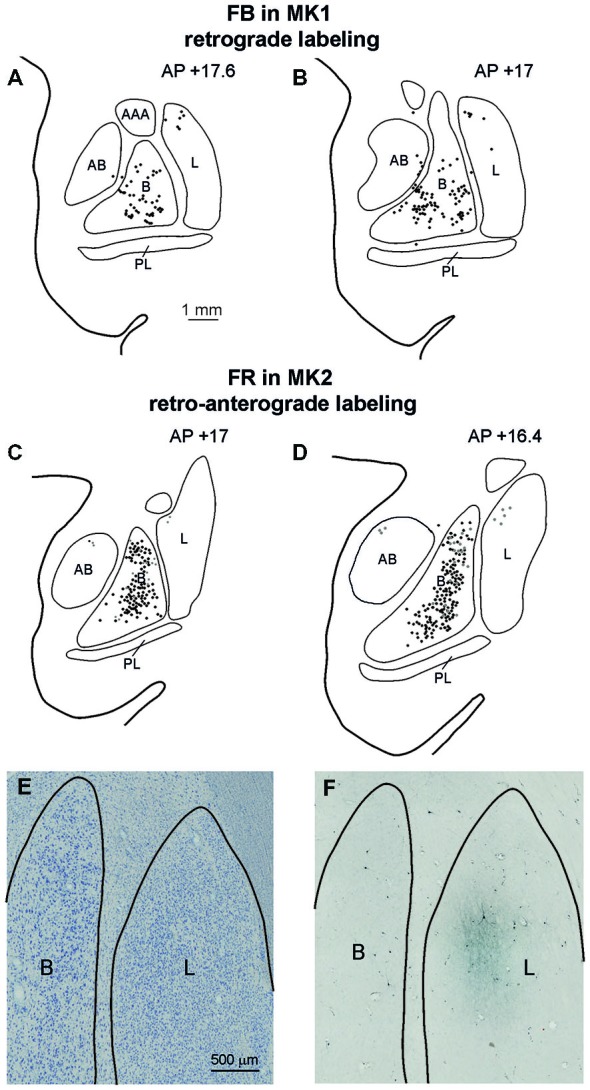
Figure 7.

(A–D) Distribution of the amygdala retrograde and of the retro-anterograde labeling observed after injections of FB in case MK1 and of FR in MK2. For each case, the labeling is shown in two drawings of coronal sections, selected at different AP levels. Scale bar in (A) applies also to (B–D). (E,F) Photomicrographs of a pair of adjacent coronal sections from Case MK2 FR, showing in (E) the distribution of retro- and anterograde labeling in the lateral and basal nucleus, compared with cytoarchitectonic subdivisions, shown in (F). Scale bar in (E) applies also to (F). AB, accessory basal nucleus; B, basal nucleus; L, lateral nucleus, PL, paralaminar nucleus. Conventions as in Figure 3.
