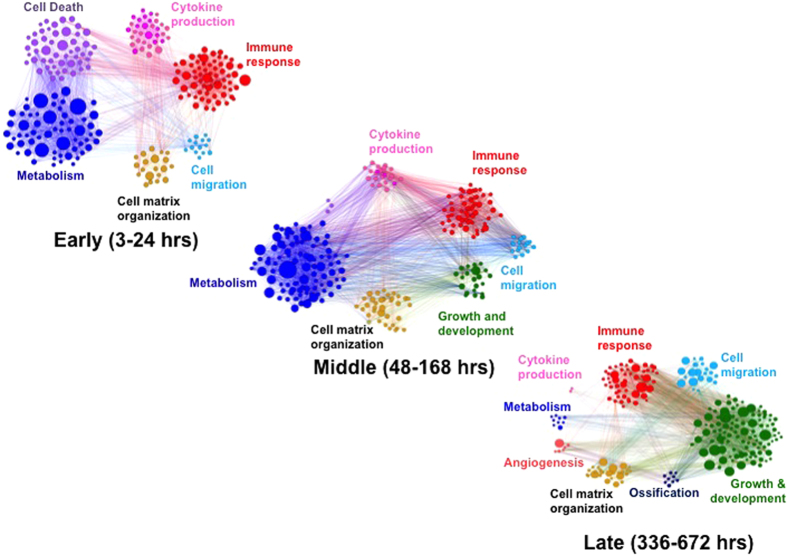
Figure 5. Temporal evolution of transcriptional coregulated networks organized by function after traumatic injury.
Each network diagram is composed of statistically significant functional enrichments, where Gene Ontology (GO) terms are clustered by functional category such that all terms with a common ancestor term are the same color. The size of each circle corresponds to the corrected P-value of the associated GO term, and edges in the graph represent interactions between associated GO terms.

