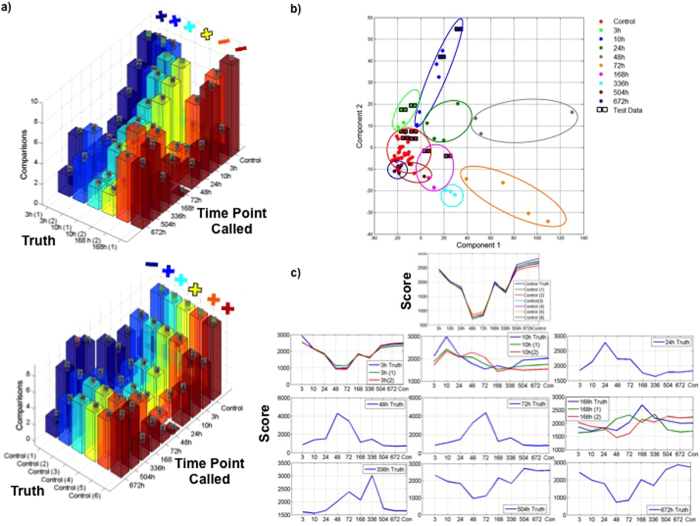
Figure 6. Results from various bioinformatics classification schemes utilized to analyze transcriptomic datasets show accurate categorization of injured and uninjured samples.
(a) One-versus-one support vector classification results for test samples. A test sample was analyzed with 45 classifiers, each of which assigned the sample to one of two time points. Voting was used to group classifier results. The height of the bars indicates the number of votes given to each time point for a given sample. Top graph displays classification results for injured samples – 2 samples from 3h after injury, 2 samples for 10 h, 2 samples for 168 h. Bottom graph displays classification of results for 6 control samples. (b) Principal component analysis clustering of 12 test samples at the gene level. 66 training samples and 12 test samples are plotted in the space of principal components 1 and 2. Labels specify the time point of the nearest training sample for each of the test samples. Misclassified samples are circled in red. All other sample classifications were correct. (c) Similarity profiles of training and test samples to the control data and each of the 9 injured time points. Truth sample profiles are indicated in blue. If a scored sample and a truth sample for a given time point both exhibit a fold change for a gene, or if both exhibit no fold change for the gene, the score is incremented. The score increment is equal to the normalized fold change (on a scale from 0 to 1) in the truth sample relative to a control, or 0.5 if both sample exhibit no fold change.

