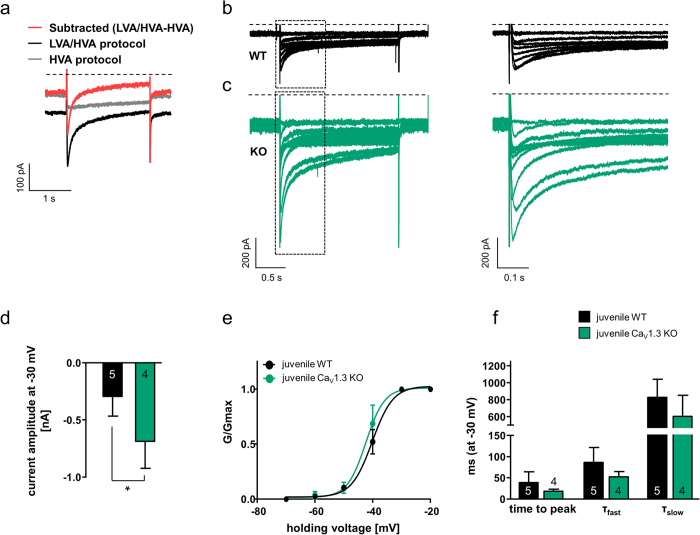
Figure 5. Larger amplitudes of fast-inactivating low-voltage activated, T-type calcium channel currents in SN DA neurons from juvenile Cav1.3 KO mice.
(a) Overlay of representative currents recorded from a juvenile WT SN DA neuron in response to a single step to −30 mV from a LVA/HVA composite protocol (holding current of −100 mV, black trace) and from a HVA protocol (holding current of −60 mV, gray trace), to discriminate between low and high voltage activated currents (LVA/HVA). The red trace represents the subtracted current. Currents were evaluated for their time to peak. The subtracted LVA currents and the LVA/HVA composite current were consistently fitted with a two exponential decay (tau fast [τfast] and tau slow [τslow]). Scale bar 100 pA/1s. (b/c) Representative traces of subtracted, fast-inactivating T-type calcium channel blocker Z944-sensitive barium currents in juvenile SN DA neurons from a WT and a Cav1.3 KO mouse (response to 10 mV incremental depolarising pulses to 0 mV from a holding potential of −100 mV). Dotted boxes indicates the expanded view of the left hand traces shown on the right. Currents exhibited a voltage-dependent fast-activation and voltage-dependent fast-inactivation. Scale bars: left traces: 200 pA/1 s; right traces: 200 pA/500ms. (d) Maximal current amplitude of T-type barium currents in juvenile WT and Cav1.3 KO SN DA neurons at a test voltage of −30 mV. Note that the peak amplitude is significantly (about 3-fold) larger in Cav1.3 KO, suggesting elevated T-type currents (WMWU = 0, p = 0.02). (e) Steady-state activation curves for putative T-type barium currents in WT and Cav1.3 KO mice. Plot represents the ratio of conductance (G) to the maximal conductance (Gmax) and has been fitted with a single Boltzmann equation to identify the voltage for half-maximal activation (V50) and the slope (s) of the steady-state activation curve. Note similar steady-state activation of T-type currents in WT and KO. (f) Kinetic properties (time to peak and inactivation time constants τfast and τslow) of T-type currents at a test voltage of −30 mV are similar in SN DA neurons from juvenile WT and Cav1.3 KO mice. All data are shown as mean ± SEM, WT data in black and KO data in green. Significant differences are marked by asterisks.

