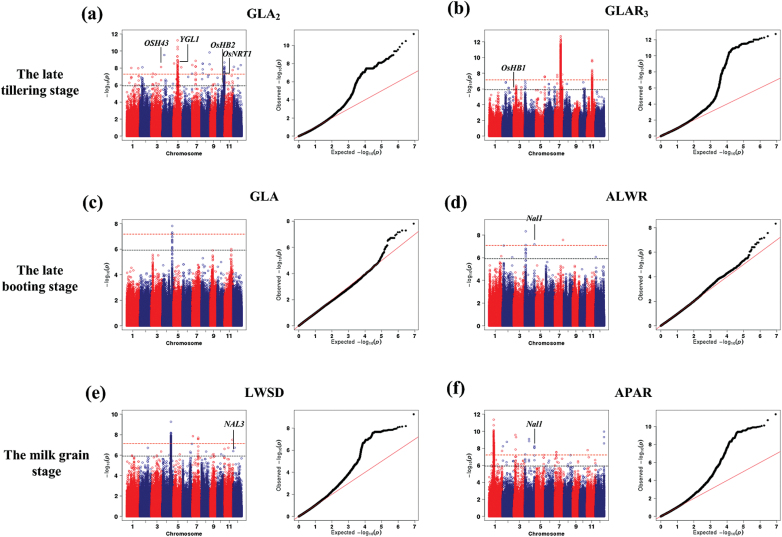
Fig. 6.
Genome-wide association studies of six leaf traits. Manhattan plots (left) and quantile-quantile plots (right) for (a) GLA2 and (b) GLAR3 at late tillering stage; (c) GLA and (d) ALWR at late booting stage; (e) LWSD and (f) APAR at milk grain stage. For Manhattan plots, -log10 P-values from a genome-wide scan are plotted against the position of the SNPs on each of 12 chromosomes and the horizontal grey dashed line indicates the genome-wide suggestive threshold (P = 1.21×10⁻⁶). The red dashed line indicates the genome-wide significant threshold (P = 6.03×10⁻⁸). For quantile-quantile plots, the horizontal axis shows the -log10-transformed expected P-values, and the vertical axis indicates -log10-transformed observed P-values. The names of known related genes near the association signals are shown.

