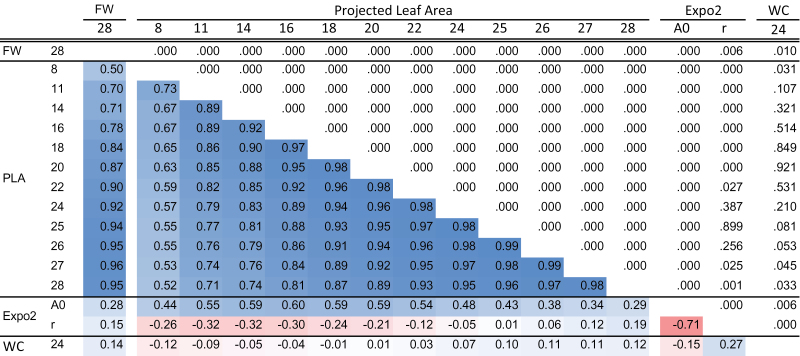
Fig. 2.
Pearson correlations between fresh weight of rosettes (FW) at the end of the experiment (day 28), projected leaf area (PLA) over time (day 8 till 28), and parameters ‘r’ and ‘A 0’ of the growth model Expo2. r 2-values are given in the left lower part of the figure, whereas corresponding P-values are given in the right upper part of the figure. Blue and red indicate positive and negative correlations, respectively. The stronger the intensity of the colour, the stronger the correlation.

