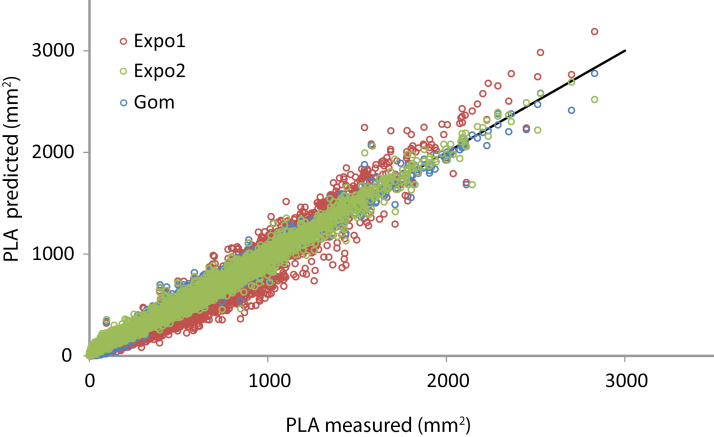
Fig. 4.
Comparison of the goodness-of-fit for the three growth models used: exponential function with one (Expo1) or two (Expo2) parameters, and Gompertz function (Gom). Plot of the measured PLA on days 8, 11, 14, 16, 18, 20, 22, 24, 25, 26, 27, and 28 against the predicted PLA on the same days. The black line represents y=x (PLA measured=PLA predicted).

