
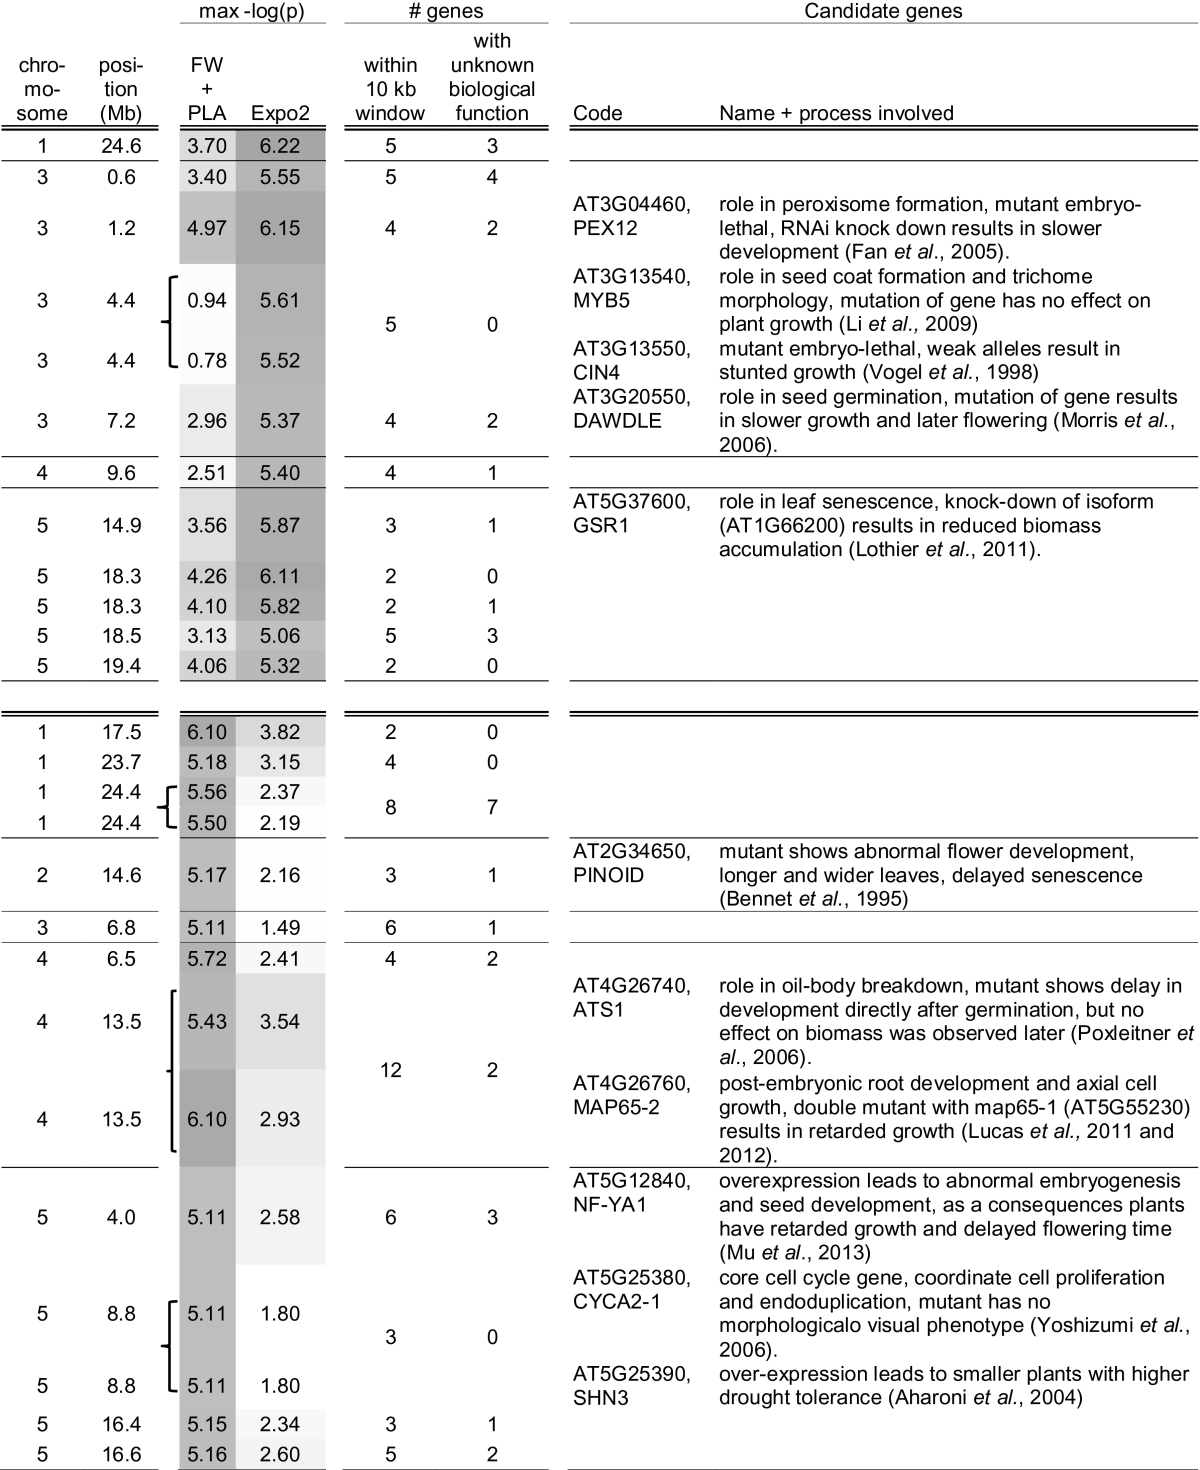
Table 3.
Information about the support window around the 26 SNPs that are highly associated with the growth traits [–log(P)>5]
The order of SNPs corresponds to those in Fig. 6 to enable easy comparison of the data presented. Bold indicates that associated SNPs are located within 10kb and can be considered as one QTL.
|