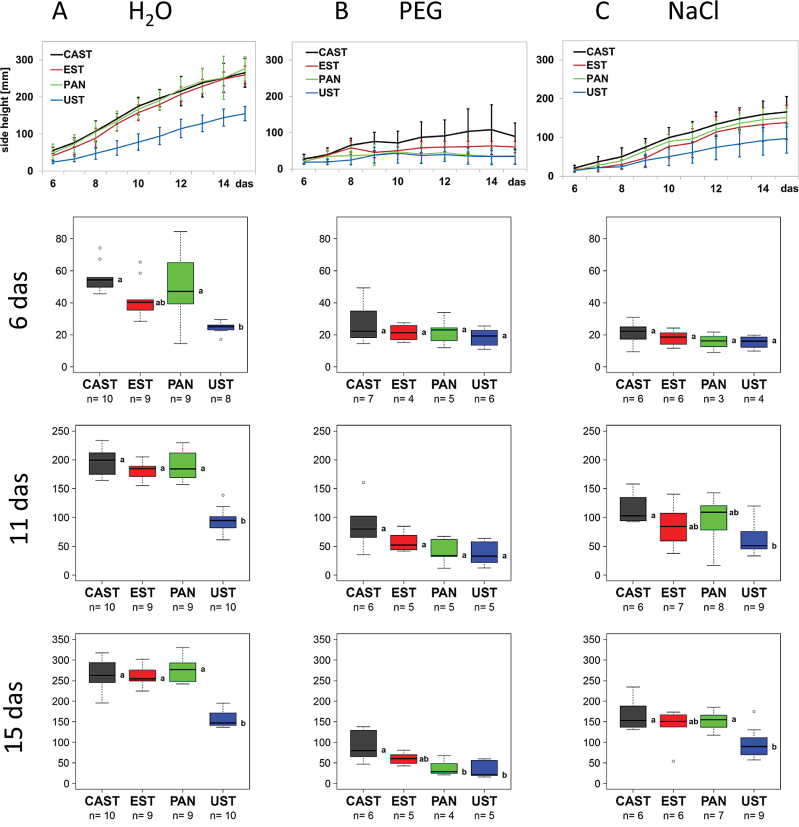
Fig. 3.
Growth dynamics of four lentil accessions under (A) control (H2O), (B) osmotic stress (PEG), and (C) salt stress (NaCl). Growth curves (upper panel, mean values of 4–10 replicates with bars indicating the SEM) represent plant height development as extracted from RGB side images of the plants from day 6 to 15 after sowing (das). Box plots represent variation in the height of plants of the different genotypes at day 6, 11, and 15 after sowing, with the letters indicating significant differences according to Tukey’s test. (This figure is available in colour at JXB online.)

